Estimated Value: $138,532 - $198,000
3
Beds
1
Bath
1,140
Sq Ft
$139/Sq Ft
Est. Value
About This Home
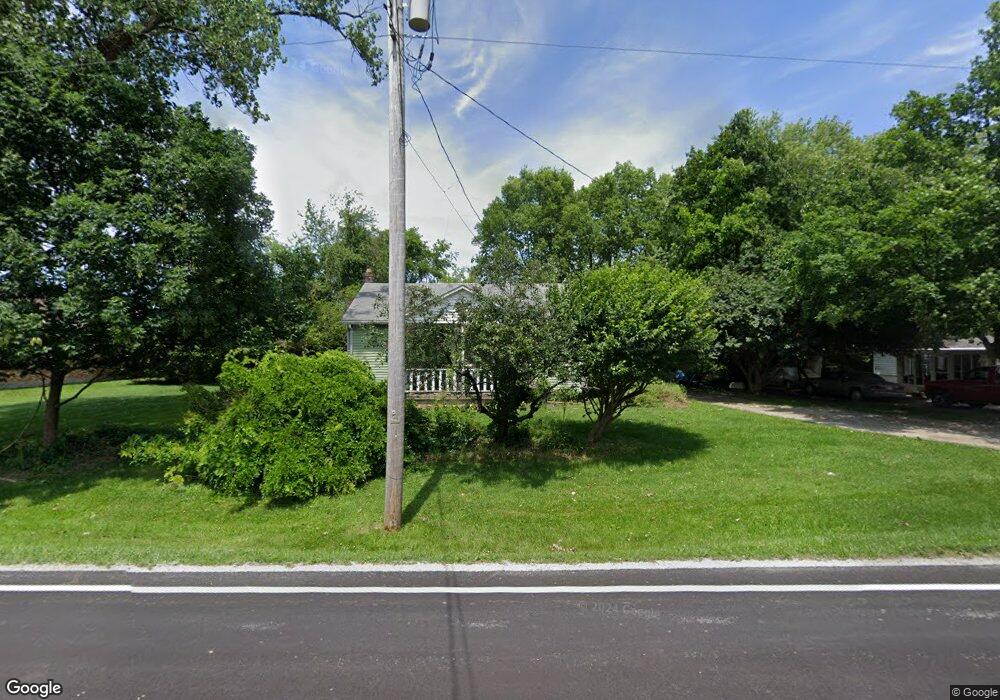
This home is located at 1010 Jasper Rd, Xenia, OH 45385 and is currently estimated at $158,883, approximately $139 per square foot. 1010 Jasper Rd is a home located in Greene County with nearby schools including Xenia High School, Summit Academy Community School for Alternative Learners - Xenia, and Legacy Christian Academy.
Ownership History
Date
Name
Owned For
Owner Type
Purchase Details
Closed on
May 29, 2007
Sold by
Gambrel Stanley W
Bought by
Gambrel Jerrold S
Current Estimated Value
Purchase Details
Closed on
Feb 13, 2004
Sold by
Gultice Betty and Gultice Betty J
Bought by
Gambrel Stanley W and Gambrel Jerrold S
Home Financials for this Owner
Home Financials are based on the most recent Mortgage that was taken out on this home.
Original Mortgage
$46,800
Interest Rate
5.96%
Mortgage Type
Unknown
Create a Home Valuation Report for This Property
The Home Valuation Report is an in-depth analysis detailing your home's value as well as a comparison with similar homes in the area
Home Values in the Area
Average Home Value in this Area
Purchase History
| Date | Buyer | Sale Price | Title Company |
|---|---|---|---|
| Gambrel Jerrold S | -- | Attorney | |
| Gambrel Stanley W | $52,000 | Midwest Abstract Company |
Source: Public Records
Mortgage History
| Date | Status | Borrower | Loan Amount |
|---|---|---|---|
| Previous Owner | Gambrel Stanley W | $46,800 |
Source: Public Records
Tax History Compared to Growth
Tax History
| Year | Tax Paid | Tax Assessment Tax Assessment Total Assessment is a certain percentage of the fair market value that is determined by local assessors to be the total taxable value of land and additions on the property. | Land | Improvement |
|---|---|---|---|---|
| 2024 | $940 | $29,620 | $11,160 | $18,460 |
| 2023 | $940 | $29,620 | $11,160 | $18,460 |
| 2022 | $707 | $22,270 | $7,970 | $14,300 |
| 2021 | $1,209 | $22,270 | $7,970 | $14,300 |
| 2020 | $1,162 | $22,270 | $7,970 | $14,300 |
| 2019 | $950 | $17,090 | $7,500 | $9,590 |
| 2018 | $953 | $17,090 | $7,500 | $9,590 |
| 2017 | $928 | $17,090 | $7,500 | $9,590 |
| 2016 | $1,128 | $19,880 | $7,040 | $12,840 |
| 2015 | $1,131 | $19,880 | $7,040 | $12,840 |
| 2014 | $1,086 | $19,880 | $7,040 | $12,840 |
Source: Public Records
Map
Nearby Homes
- 0 Gultice Rd Unit 940427
- 1293 E Main St
- 0 N Patton St
- 00 N Patton St
- 654 E 3rd St
- 607 E Main St
- 645 E Church St
- 612 E Market St
- 541 E Main St
- 373 Hill St
- 240 E 2nd St
- 568 Louise Dr
- 222 Washington St
- 656 Eden Roc Dr
- 610 Saxony Dr
- 479 N Stadium Dr
- 348 S Stadium Dr
- 508 Marshall Dr
- 513 Redbud Ln
- 36 Leaman St