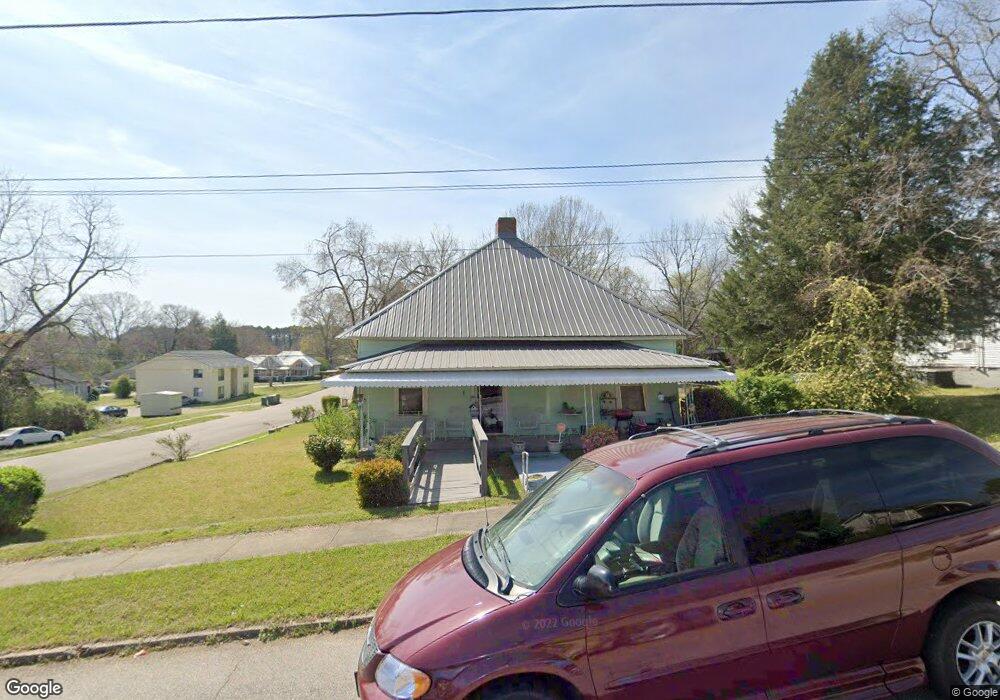
1010 Juniper St Lagrange, GA 30240
Estimated Value: $111,000 - $183,000
3
Beds
2
Baths
1,492
Sq Ft
$93/Sq Ft
Est. Value
About This Home
This home is located at 1010 Juniper St, Lagrange, GA 30240 and is currently estimated at $139,281, approximately $93 per square foot. 1010 Juniper St is a home located in Troup County with nearby schools including Berta Weathersbee Elementary School, Whitesville Road Elementary School, and Rosemont Elementary School.
Ownership History
Date
Name
Owned For
Owner Type
Purchase Details
Closed on
May 16, 2003
Sold by
Dunson Charlie
Bought by
Dunson Charlie and Dunson Marilyn
Current Estimated Value
Purchase Details
Closed on
Jun 27, 1997
Sold by
Ralph Matthews J
Bought by
Dunson Charlie
Purchase Details
Closed on
Mar 13, 1996
Sold by
Vines Michael/Sec Vet Affairs
Bought by
Ralph Matthews J
Purchase Details
Closed on
Nov 24, 1976
Sold by
Administrator Of Veterans Aff
Bought by
Vines Michael/Sec Vet Affairs
Purchase Details
Closed on
Oct 25, 1975
Sold by
Engel Mortgage Company Inc
Bought by
Administrator Of Veterans Aff
Purchase Details
Closed on
Oct 24, 1975
Sold by
Veal Robert Wayne
Bought by
Engel Mortgage Company Inc
Purchase Details
Closed on
Sep 11, 1974
Sold by
Bell Bell W and Bell Mable A
Bought by
Veal Robert Wayne
Purchase Details
Closed on
Sep 1, 1951
Sold by
Callaway Community Fdn
Bought by
Bell Bell W and Bell Mable A
Create a Home Valuation Report for This Property
The Home Valuation Report is an in-depth analysis detailing your home's value as well as a comparison with similar homes in the area
Purchase History
| Date | Buyer | Sale Price | Title Company |
|---|---|---|---|
| Dunson Charlie | -- | -- | |
| Dunson Charlie | $52,000 | -- | |
| Ralph Matthews J | $11,300 | -- | |
| Vines Michael/Sec Vet Affairs | $12,000 | -- | |
| Administrator Of Veterans Aff | -- | -- | |
| Engel Mortgage Company Inc | $13,400 | -- | |
| Veal Robert Wayne | $16,800 | -- | |
| Bell Bell W | -- | -- |
Source: Public Records
Tax History
| Year | Tax Paid | Tax Assessment Tax Assessment Total Assessment is a certain percentage of the fair market value that is determined by local assessors to be the total taxable value of land and additions on the property. | Land | Improvement |
|---|---|---|---|---|
| 2025 | $660 | $35,720 | $2,600 | $33,120 |
| 2024 | $580 | $31,200 | $2,600 | $28,600 |
| 2023 | $17 | $28,480 | $2,600 | $25,880 |
| 2022 | $467 | $26,680 | $2,600 | $24,080 |
| 2021 | $319 | $20,520 | $2,600 | $17,920 |
| 2020 | $319 | $20,520 | $2,600 | $17,920 |
| 2019 | $286 | $19,440 | $2,600 | $16,840 |
| 2018 | $280 | $19,212 | $2,612 | $16,600 |
| 2017 | $280 | $19,212 | $2,612 | $16,600 |
| 2016 | $276 | $19,060 | $2,612 | $16,448 |
| 2015 | $278 | $19,060 | $2,612 | $16,448 |
| 2014 | $294 | $19,568 | $2,612 | $16,956 |
| 2013 | -- | $20,572 | $2,612 | $17,960 |
Source: Public Records
Map
Nearby Homes
- 1008 Juniper St
- 1100 Juniper St
- 0 Juniper St
- 1006 Juniper St
- 1009 Juniper St
- 1011 Park Ave
- 1101 Juniper St
- 1011 Juniper St
- 1009 Park Ave
- 1101 Park Ave
- 1007 Park Ave
- 1004 Juniper St
- 1007 Juniper St
- 1103 Park Ave
- 1103 Juniper St
- 1104 Juniper St
- 1005 Park Ave
- 1100 Park Ave
- 1010 Park Ave
- 1005 Juniper St
Your Personal Tour Guide
Ask me questions while you tour the home.