1010 Lookout Trail Unit 119 West Carrollton, OH 45449
Estimated Value: $90,000 - $96,000
3
Beds
2
Baths
1,089
Sq Ft
$86/Sq Ft
Est. Value
About This Home
This home is located at 1010 Lookout Trail Unit 119, West Carrollton, OH 45449 and is currently estimated at $93,204, approximately $85 per square foot. 1010 Lookout Trail Unit 119 is a home located in Montgomery County with nearby schools including West Carrollton High School and Bethel Baptist School.
Ownership History
Date
Name
Owned For
Owner Type
Purchase Details
Closed on
Jul 10, 2017
Sold by
Girdler Beth L
Bought by
Thompson Kathryn
Current Estimated Value
Purchase Details
Closed on
Apr 16, 2015
Sold by
Harbach Shirley G
Bought by
Girdler Beth L
Purchase Details
Closed on
Mar 5, 2003
Sold by
Erby Rebecca S
Bought by
Harbach Shirley G
Home Financials for this Owner
Home Financials are based on the most recent Mortgage that was taken out on this home.
Original Mortgage
$45,500
Interest Rate
5.87%
Mortgage Type
Purchase Money Mortgage
Purchase Details
Closed on
Aug 22, 2000
Sold by
Smith Jan L and Smith Jan L
Bought by
Erby Rebecca S
Home Financials for this Owner
Home Financials are based on the most recent Mortgage that was taken out on this home.
Original Mortgage
$52,450
Interest Rate
8.15%
Mortgage Type
FHA
Create a Home Valuation Report for This Property
The Home Valuation Report is an in-depth analysis detailing your home's value as well as a comparison with similar homes in the area
Home Values in the Area
Average Home Value in this Area
Purchase History
| Date | Buyer | Sale Price | Title Company |
|---|---|---|---|
| Thompson Kathryn | $46,500 | Vantage Land Title | |
| Girdler Beth L | $12,500 | None Available | |
| Harbach Shirley G | $54,000 | Mid America Land Title Agenc | |
| Erby Rebecca S | $53,700 | -- |
Source: Public Records
Mortgage History
| Date | Status | Borrower | Loan Amount |
|---|---|---|---|
| Previous Owner | Harbach Shirley G | $45,500 | |
| Previous Owner | Erby Rebecca S | $52,450 |
Source: Public Records
Tax History Compared to Growth
Tax History
| Year | Tax Paid | Tax Assessment Tax Assessment Total Assessment is a certain percentage of the fair market value that is determined by local assessors to be the total taxable value of land and additions on the property. | Land | Improvement |
|---|---|---|---|---|
| 2024 | $1,087 | $17,730 | $3,890 | $13,840 |
| 2023 | $1,087 | $17,730 | $3,890 | $13,840 |
| 2022 | $1,003 | $12,790 | $2,800 | $9,990 |
| 2021 | $1,004 | $12,790 | $2,800 | $9,990 |
| 2020 | $1,004 | $12,790 | $2,800 | $9,990 |
| 2019 | $1,023 | $12,060 | $2,800 | $9,260 |
| 2018 | $959 | $12,060 | $2,800 | $9,260 |
| 2017 | $952 | $12,060 | $2,800 | $9,260 |
| 2016 | $1,125 | $13,990 | $2,800 | $11,190 |
| 2015 | $1,033 | $13,990 | $2,800 | $11,190 |
| 2014 | $1,033 | $13,990 | $2,800 | $11,190 |
| 2012 | -- | $15,120 | $3,360 | $11,760 |
Source: Public Records
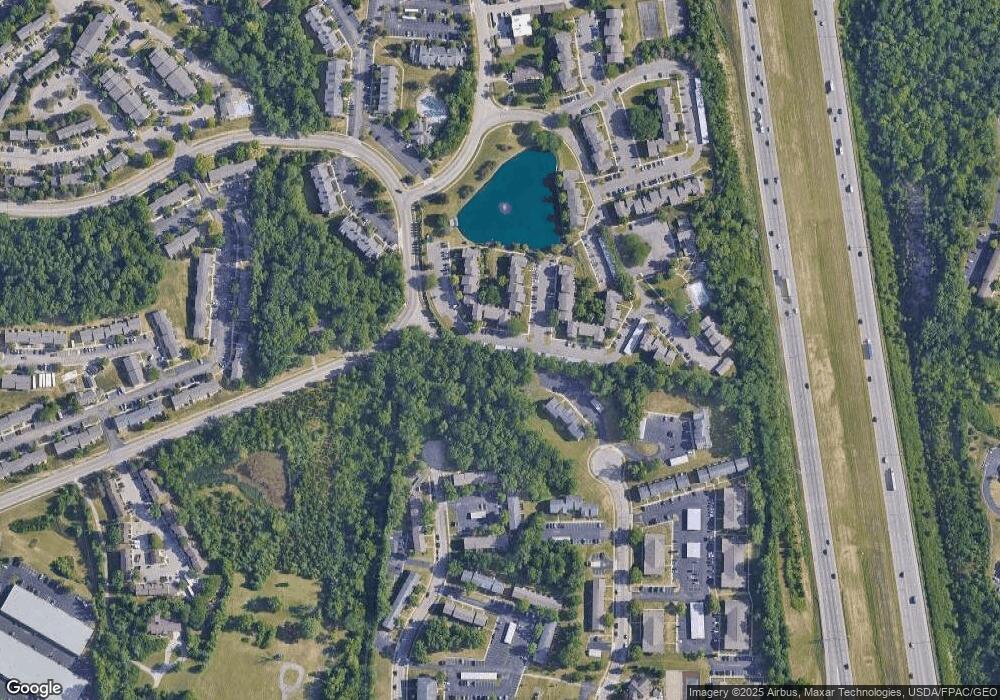
Map
Nearby Homes
- 1008 Lookout Trail Unit C
- 1124 Eagle Feather Cir Unit 161
- 1788 Cherokee Dr Unit F
- 1792 Cherokee Dr Unit A
- 1792 Cherokee Dr Unit F
- 1112 Eagle Feather Cir Unit A
- 1116 Eagle Feather Cir Unit E
- 1109 Arrowhead Crossing Unit A
- 3324 Ultimate Way Unit 36
- 6484 Quintessa Ct Unit 29
- 3316 Vanquil Trail Unit 387
- 3304 Ultimate Way Unit 399
- 6433 Interlude Ln Unit 438
- 3254 Gambit Square Unit 451
- 1333 S Elm St
- 3074 Bright Bounty Ln Unit 38
- 3060 Bright Bounty Ln Unit 13
- 3056 Bright Bounty Ln Unit 220
- 1642 Longbow Ln
- 3034 Bright Bounty Ln Unit 29
- 1010 Lookout Trail Unit 1023D
- 1010 Lookout Trail Unit 1021D
- 1010 Lookout Trail Unit 124
- 1010 Lookout Trail Unit 123
- 1010 Lookout Trail Unit 122
- 1010 Lookout Trail Unit 121
- 1010 Lookout Trail Unit 120
- 1010 Lookout Trail Unit C
- 1010 Lookout Trail Unit 22
- 1010 Lookout Trail Unit 19
- 1010 Lookout Trail
- 1010 Lookout Trail Unit A
- 1010 Lookout Trail Unit D
- 1010 Lookout Trail Unit B
- 1010 Lookout Trail Unit F
- 1010 Lookout Trail Unit E
- 1008 Lookout Trail Unit F
- 1008 Lookout Trail
- 1008 Lookout Trail Unit 1013C
- 1008 Lookout Trail Unit 118