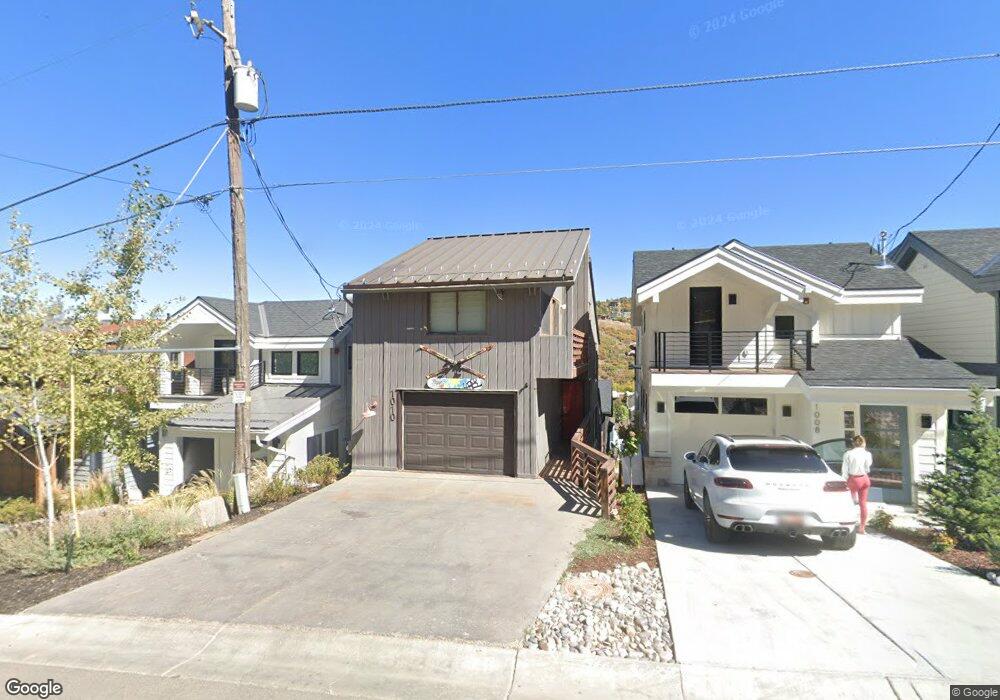
1010 Lowell Ave Unit 30 Park City, UT 84060
Estimated Value: $1,836,000 - $2,112,000
2
Beds
2
Baths
1,287
Sq Ft
$1,548/Sq Ft
Est. Value
About This Home
This home is located at 1010 Lowell Ave Unit 30, Park City, UT 84060 and is currently estimated at $1,992,239, approximately $1,547 per square foot. 1010 Lowell Ave Unit 30 is a home located in Summit County with nearby schools including McPolin Elementary School, Treasure Mountain Junior High School, and Ecker Hill Middle School.
Ownership History
Date
Name
Owned For
Owner Type
Purchase Details
Closed on
Feb 6, 2025
Sold by
Dixie Chicken Llc
Bought by
Tc Communications Llc
Current Estimated Value
Home Financials for this Owner
Home Financials are based on the most recent Mortgage that was taken out on this home.
Original Mortgage
$100,000
Outstanding Balance
$99,406
Interest Rate
6.91%
Mortgage Type
Seller Take Back
Estimated Equity
$1,892,833
Purchase Details
Closed on
May 17, 2018
Sold by
Kloeffler Sidesel and The Sidesel Kloeffler Revocabl
Bought by
Dixie Chicken Llc
Purchase Details
Closed on
Nov 21, 2012
Sold by
Loeffler Martin and Loeffler Sidsel
Bought by
Loeffler Sidsel
Create a Home Valuation Report for This Property
The Home Valuation Report is an in-depth analysis detailing your home's value as well as a comparison with similar homes in the area
Home Values in the Area
Average Home Value in this Area
Purchase History
| Date | Buyer | Sale Price | Title Company |
|---|---|---|---|
| Tc Communications Llc | -- | Real Advantage Title Insurance | |
| Tc Communications Llc | -- | Real Advantage Title Insurance | |
| Dixie Chicken Llc | -- | First American Title Ins Co | |
| Loeffler Sidsel | -- | City Title Co |
Source: Public Records
Mortgage History
| Date | Status | Borrower | Loan Amount |
|---|---|---|---|
| Open | Tc Communications Llc | $100,000 | |
| Closed | Tc Communications Llc | $100,000 |
Source: Public Records
Tax History Compared to Growth
Tax History
| Year | Tax Paid | Tax Assessment Tax Assessment Total Assessment is a certain percentage of the fair market value that is determined by local assessors to be the total taxable value of land and additions on the property. | Land | Improvement |
|---|---|---|---|---|
| 2024 | $10,133 | $1,529,270 | $1,050,000 | $479,270 |
| 2023 | $10,133 | $1,797,204 | $1,050,000 | $747,204 |
| 2022 | $8,378 | $1,271,918 | $800,000 | $471,918 |
| 2021 | $7,569 | $993,265 | $600,000 | $393,265 |
| 2020 | $8,035 | $993,265 | $600,000 | $393,265 |
| 2019 | $8,177 | $993,265 | $600,000 | $393,265 |
| 2018 | $4,762 | $578,445 | $300,000 | $278,445 |
| 2017 | $4,389 | $561,273 | $300,000 | $261,273 |
| 2016 | $4,095 | $509,755 | $300,000 | $209,755 |
| 2015 | $4,323 | $509,755 | $0 | $0 |
| 2013 | $3,727 | $409,755 | $0 | $0 |
Source: Public Records
Map
Nearby Homes
- 1037 Northstar Dr Unit 10
- 1063 Lowell Ave Unit 1
- 1009 Norfolk Ave
- 1015 Norfolk Ave
- 1003 Norfolk Ave
- 1271 Lowell Ave Unit C202
- 1150 Empire Ave Unit 33
- 1150 Empire Ave Unit 56
- 1020 Woodside Ave
- 1109 Park Ave
- 1216 Rothwell Rd
- 1125 Park Ave Unit 4
- 1125 Park Ave Unit 3
- 950 Park Ave Unit 236
- 1000 Park Ave Unit C304
- 1252 Rothwell Rd
- 0 No Situs Unit 12502874
- 820 Park Ave Unit 203
- 1012 Lowell Ave
- 1004 Lowell Ave
- 1016 Lowell Ave
- 1030 Lowell Ave
- 1007 Empire Ave
- 1009 Empire Ave
- 1018 Lowell Ave
- 1011 Empire Ave
- 1011 Empire Ave Unit A
- 1003 Empire Ave
- 1026 Lowell Ave
- 1022 Lowell Ave
- 952 Lowell Ave
- 1011A Empire Ave
- 1001 Lowell Ave
- 963 Empire Ave
- 1013 Empire Ave
- 1036 Lowell Ave
- 953 Empire Ave
- 950 Lowell Ave