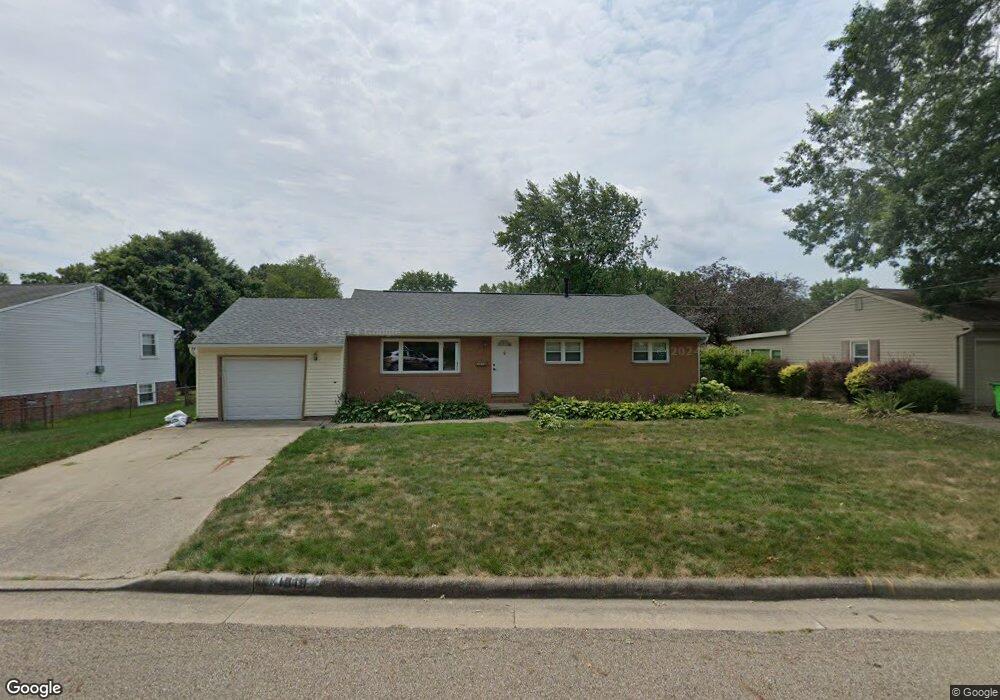
1010 Lynbrook St SE North Canton, OH 44720
Mount Vernon NeighborhoodEstimated Value: $184,654 - $231,000
3
Beds
2
Baths
1,204
Sq Ft
$176/Sq Ft
Est. Value
About This Home
This home is located at 1010 Lynbrook St SE, North Canton, OH 44720 and is currently estimated at $211,664, approximately $175 per square foot. 1010 Lynbrook St SE is a home located in Stark County with nearby schools including North Canton Middle School, Hoover High School, and St Paul School.
Ownership History
Date
Name
Owned For
Owner Type
Purchase Details
Closed on
Dec 5, 2024
Sold by
Mosher Gary
Bought by
Mosher Michelle
Current Estimated Value
Home Financials for this Owner
Home Financials are based on the most recent Mortgage that was taken out on this home.
Original Mortgage
$140,000
Outstanding Balance
$138,845
Interest Rate
6.54%
Mortgage Type
New Conventional
Estimated Equity
$72,819
Purchase Details
Closed on
Feb 6, 2023
Sold by
Maier George T
Bought by
Mosher Gary
Purchase Details
Closed on
Apr 29, 2003
Sold by
Riehl Talitha H
Bought by
Herman Richard L
Home Financials for this Owner
Home Financials are based on the most recent Mortgage that was taken out on this home.
Original Mortgage
$111,483
Interest Rate
5.86%
Mortgage Type
VA
Create a Home Valuation Report for This Property
The Home Valuation Report is an in-depth analysis detailing your home's value as well as a comparison with similar homes in the area
Home Values in the Area
Average Home Value in this Area
Purchase History
| Date | Buyer | Sale Price | Title Company |
|---|---|---|---|
| Mosher Michelle | $175,000 | None Listed On Document | |
| Mosher Michelle | $175,000 | None Listed On Document | |
| Mosher Gary | $131,200 | -- | |
| Herman Richard L | $108,500 | Cornerstone Real Estate Titl |
Source: Public Records
Mortgage History
| Date | Status | Borrower | Loan Amount |
|---|---|---|---|
| Open | Mosher Michelle | $140,000 | |
| Closed | Mosher Michelle | $140,000 | |
| Previous Owner | Herman Richard L | $111,483 |
Source: Public Records
Tax History Compared to Growth
Tax History
| Year | Tax Paid | Tax Assessment Tax Assessment Total Assessment is a certain percentage of the fair market value that is determined by local assessors to be the total taxable value of land and additions on the property. | Land | Improvement |
|---|---|---|---|---|
| 2025 | -- | $44,880 | $14,180 | $30,700 |
| 2024 | -- | $44,880 | $14,180 | $30,700 |
| 2023 | $1,901 | $35,530 | $10,500 | $25,030 |
| 2022 | $1,829 | $35,530 | $10,500 | $25,030 |
| 2021 | $1,764 | $35,530 | $10,500 | $25,030 |
| 2020 | $1,711 | $30,950 | $9,140 | $21,810 |
| 2019 | $1,597 | $30,950 | $9,140 | $21,810 |
| 2018 | $1,656 | $30,950 | $9,140 | $21,810 |
| 2017 | $1,457 | $28,600 | $8,160 | $20,440 |
| 2016 | $1,463 | $28,600 | $8,160 | $20,440 |
| 2015 | $1,714 | $33,400 | $8,160 | $25,240 |
| 2014 | $1,707 | $31,050 | $7,600 | $23,450 |
| 2013 | $857 | $31,050 | $7,600 | $23,450 |
Source: Public Records
Map
Nearby Homes
- 1126 Overridge Ave SE
- 1118 Overridge Ave SE
- 1321 Clinton Ave SE
- 505 Rose Lane St SE
- 1381 Circle Hill Rd SE
- 1402 Schneider St NW
- 322 Schneider St SE
- 634 Edgewood St SE
- 1415 Red Coach St SE
- 701 Edgewood St SE
- 714 Pershing Ave SE
- 723 Jennifer Dr NW
- 139 Maplecrest St SW
- 161 Hallum St SW
- 218 Bonnett St SW
- 1603 S Main St Unit B
- 1573 Lancaster Gate SE
- 1224 Grassmere St SE
- 1338 Shiloh Run SE
- 1331 Shiloh Run SE
- 1018 Lynbrook St SE
- 1011 Oakwood St SE
- 1003 Oakwood St SE
- 1017 Oakwood St SE
- 1017 Lynbrook St SE
- 1030 Lynbrook St SE
- 1011 Lynbrook St SE
- 930 Lynbrook St SE
- 1023 Lynbrook St SE
- 1025 Oakwood St SE
- 931 Oakwood St SE
- 924 Lynbrook St SE
- 925 Oakwood St SE
- 929 Lynbrook St SE
- 1232 Sunford Ave SE
- 1008 Oakwood St SE
- 1037 Lynbrook St SE
- 1014 Oakwood St SE
- 1002 Oakwood St SE
- 918 Lynbrook St SE