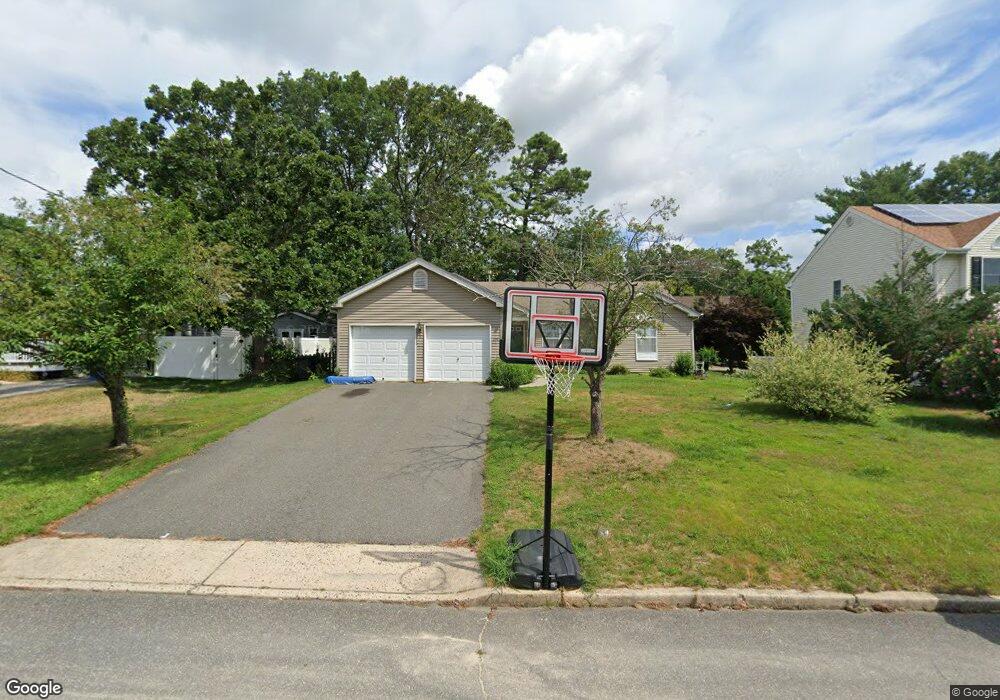
1010 Midship Ave Manahawkin, NJ 08050
Stafford NeighborhoodEstimated Value: $481,697 - $503,000
3
Beds
2
Baths
1,518
Sq Ft
$325/Sq Ft
Est. Value
About This Home
This home is located at 1010 Midship Ave, Manahawkin, NJ 08050 and is currently estimated at $493,424, approximately $325 per square foot. 1010 Midship Ave is a home located in Ocean County with nearby schools including Ocean Acres Elementary School, Oxycocus Elementary School, and McKinley Avenue Elementary School.
Ownership History
Date
Name
Owned For
Owner Type
Purchase Details
Closed on
Dec 9, 2024
Sold by
L And I Trading Llc
Bought by
1216 Sixth Llc
Current Estimated Value
Home Financials for this Owner
Home Financials are based on the most recent Mortgage that was taken out on this home.
Original Mortgage
$336,000
Outstanding Balance
$333,368
Interest Rate
6.81%
Mortgage Type
Construction
Estimated Equity
$160,056
Purchase Details
Closed on
Sep 30, 2024
Sold by
Sheriff Of The County Of Ocean
Bought by
L And I Trading Llc
Purchase Details
Closed on
Dec 30, 2008
Sold by
Obenhaus John R and Frager Janice A
Bought by
Frager Janice A
Purchase Details
Closed on
Jun 17, 1997
Sold by
Accent Homes
Bought by
Obenhaus John and Frager Janice
Home Financials for this Owner
Home Financials are based on the most recent Mortgage that was taken out on this home.
Original Mortgage
$118,000
Interest Rate
7.87%
Mortgage Type
FHA
Create a Home Valuation Report for This Property
The Home Valuation Report is an in-depth analysis detailing your home's value as well as a comparison with similar homes in the area
Home Values in the Area
Average Home Value in this Area
Purchase History
| Date | Buyer | Sale Price | Title Company |
|---|---|---|---|
| 1216 Sixth Llc | $420,000 | Cross Bridge Title | |
| 1216 Sixth Llc | $420,000 | Cross Bridge Title | |
| L And I Trading Llc | $69,474 | Cross Bridge Title | |
| L And I Trading Llc | $69,474 | Cross Bridge Title | |
| Frager Janice A | -- | None Available | |
| Obenhaus John | $126,900 | -- |
Source: Public Records
Mortgage History
| Date | Status | Borrower | Loan Amount |
|---|---|---|---|
| Open | 1216 Sixth Llc | $336,000 | |
| Closed | 1216 Sixth Llc | $336,000 | |
| Previous Owner | Obenhaus John | $118,000 |
Source: Public Records
Tax History Compared to Growth
Tax History
| Year | Tax Paid | Tax Assessment Tax Assessment Total Assessment is a certain percentage of the fair market value that is determined by local assessors to be the total taxable value of land and additions on the property. | Land | Improvement |
|---|---|---|---|---|
| 2025 | $5,371 | $216,300 | $61,600 | $154,700 |
| 2024 | $5,319 | $216,300 | $61,600 | $154,700 |
| 2023 | $5,092 | $216,300 | $61,600 | $154,700 |
| 2022 | $5,092 | $216,300 | $61,600 | $154,700 |
| 2021 | $5,022 | $216,300 | $61,600 | $154,700 |
| 2020 | $5,029 | $216,300 | $61,600 | $154,700 |
| 2019 | $4,958 | $216,300 | $61,600 | $154,700 |
| 2018 | $4,927 | $216,300 | $61,600 | $154,700 |
| 2017 | $4,857 | $206,400 | $61,600 | $144,800 |
| 2016 | $4,807 | $206,400 | $61,600 | $144,800 |
| 2015 | $4,638 | $206,400 | $61,600 | $144,800 |
| 2014 | $4,564 | $200,600 | $60,800 | $139,800 |
Source: Public Records
Map
Nearby Homes
- 55 Holloway Ave
- 1014 Clearwater Ave
- 1073 Cutlass Ave
- 296 Nautilus Dr
- 1034 Buccaneer Ln
- 248 Matey Ave
- 223 Serpent Ln
- 372 Nautilus Dr
- 217 Middie Ln
- 220 Middie Ln
- 231 Pulley Ave
- 937 Sandy Cir
- 208 Steering Ln
- 993 Sandy Cir
- 1174 Treasure Ave
- 1174 Steamer Ave
- 909 Bonita Ln
- 140 Riptide Ave
- 0 Levi Rd Unit NJOC2030756
- 121 Reel Ave
- 1006 Midship Ave
- 1014 Midship Ave
- 1009 Driftwood Ave
- 1005 Driftwood Ave
- 1013 Driftwood Ave
- 1018 Midship Ave
- 1002 Midship Ave
- 1009 Midship Ave
- 1005 Midship Ave
- 1013 Midship Ave
- 1017 Driftwood Ave
- 360 Lighthouse Dr
- 1022 Midship Ave
- 1017 Midship Ave
- 344 Lighthouse Dr
- 1021 Driftwood Ave
- 1021 Midship Ave
- 1010 Driftwood Ave
- 1010 Cutlass Ave
- 1026 Midship Ave