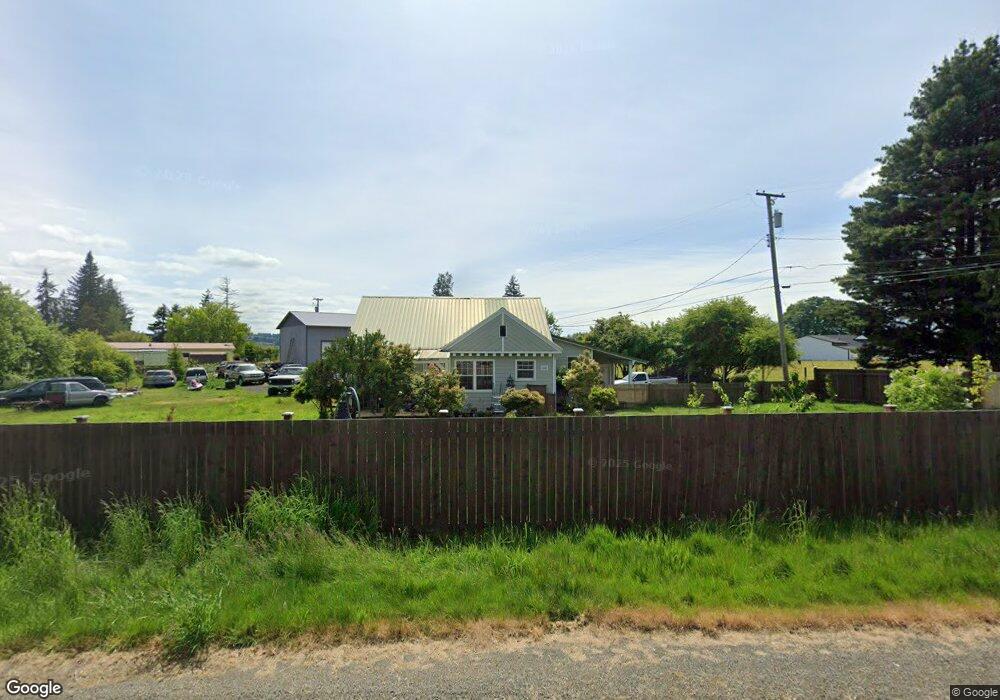
1010 Monte Elma Rd Elma, WA 98541
Satsop NeighborhoodEstimated Value: $286,000 - $463,000
--
Bed
--
Bath
1,120
Sq Ft
$344/Sq Ft
Est. Value
About This Home
This home is located at 1010 Monte Elma Rd, Elma, WA 98541 and is currently estimated at $385,542, approximately $344 per square foot. 1010 Monte Elma Rd is a home located in Grays Harbor County with nearby schools including Elma Elementary School, Elma Middle School, and Elma High School.
Ownership History
Date
Name
Owned For
Owner Type
Purchase Details
Closed on
Jun 27, 2019
Sold by
Taylor Douglas E and Taylor Patricia A
Bought by
Taylor Jeff A and Taylor Jennifer E
Current Estimated Value
Home Financials for this Owner
Home Financials are based on the most recent Mortgage that was taken out on this home.
Original Mortgage
$164,845
Outstanding Balance
$148,031
Interest Rate
5.12%
Mortgage Type
FHA
Estimated Equity
$237,511
Purchase Details
Closed on
Jul 27, 2005
Sold by
Timberland Bank
Bought by
Doyle Mark C and Doyle Deannie
Purchase Details
Closed on
Apr 27, 2005
Sold by
Doyle Mark C and Doyle Deanie
Bought by
Taylor Douglas E and Taylor Patricia A
Home Financials for this Owner
Home Financials are based on the most recent Mortgage that was taken out on this home.
Original Mortgage
$74,160
Interest Rate
1.37%
Mortgage Type
Adjustable Rate Mortgage/ARM
Create a Home Valuation Report for This Property
The Home Valuation Report is an in-depth analysis detailing your home's value as well as a comparison with similar homes in the area
Home Values in the Area
Average Home Value in this Area
Purchase History
| Date | Buyer | Sale Price | Title Company |
|---|---|---|---|
| Taylor Jeff A | $190,600 | Pacific Title | |
| Doyle Mark C | -- | None Available | |
| Taylor Douglas E | $92,373 | Pacific Title |
Source: Public Records
Mortgage History
| Date | Status | Borrower | Loan Amount |
|---|---|---|---|
| Open | Taylor Jeff A | $164,845 | |
| Previous Owner | Taylor Douglas E | $74,160 |
Source: Public Records
Tax History Compared to Growth
Tax History
| Year | Tax Paid | Tax Assessment Tax Assessment Total Assessment is a certain percentage of the fair market value that is determined by local assessors to be the total taxable value of land and additions on the property. | Land | Improvement |
|---|---|---|---|---|
| 2025 | $2,980 | $328,984 | $81,156 | $247,828 |
| 2023 | $3,007 | $317,948 | $81,156 | $236,792 |
| 2022 | $2,706 | $255,718 | $64,925 | $190,793 |
| 2021 | $1,937 | $255,718 | $64,925 | $190,793 |
| 2020 | $1,890 | $165,502 | $49,000 | $116,502 |
| 2019 | $1,456 | $159,931 | $49,000 | $110,931 |
| 2018 | $1,039 | $131,145 | $49,000 | $82,145 |
| 2017 | $956 | $74,149 | $35,000 | $39,149 |
| 2016 | $914 | $72,285 | $35,000 | $37,285 |
| 2014 | -- | $70,545 | $35,000 | $35,545 |
| 2013 | -- | $72,540 | $35,000 | $37,540 |
Source: Public Records
Map
Nearby Homes
- 1089 Monte Elma Rd
- 33 Hurd Rd
- 38 Hurd Rd Unit 34
- 11 Hobble Creek St
- 8 W Hobble Creek
- 12 W Hobble Creek
- 302 W Martin St
- 16 Pebble Creek Ct
- 17 Dry Creek Ct
- 1716 W Young St
- 107 Cascade Ct
- 1622 W Young St
- 1614 W Martin St
- 1612 W Young St
- 103 S 16th St
- 673 Monte Elma Rd
- 1421 W Main St
- 501 N 12th St
- 409 N 11th St
- 408 N 11th St
- 1009 Monte Elma Rd
- 1018 Monte Elma Rd Unit 18
- 1018 Monte Elma Rd Unit 2
- 1018 Monte Elma Rd Unit 7
- 1018 Monte Elma Rd
- 1018 Monte Elma Rd Unit 9
- 1018 Monte Elma Rd Unit 20
- 1018 Monte Elma Rd Unit 8
- 1019 Monte Elma Rd
- 31 Conley Ln
- 1006 Monte Elma Rd
- 1023 Monte Elma Rd
- 996 Monte Elma Rd
- 989 Monte Elma Rd
- 28 Conley Ln
- 1029 Monte Elma Rd
- 984 Monte Elma Rd
- 1022 Monte Elma Rd
- 42 Conley Ln