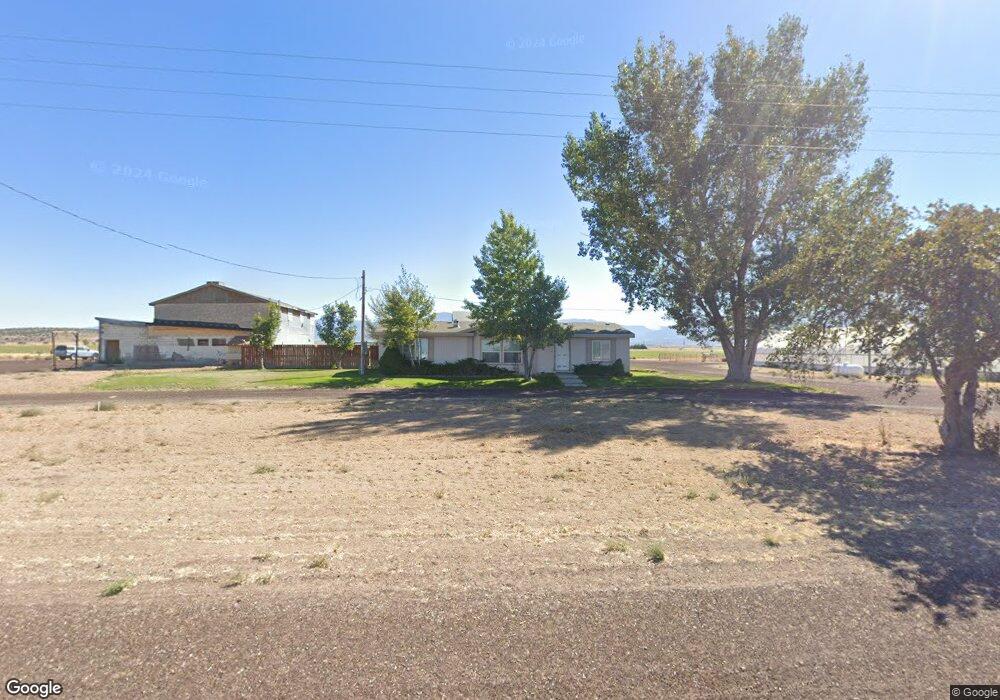
1010 N 3900 W Fillmore, UT 84631
Estimated Value: $70,726 - $497,000
--
Bed
--
Bath
--
Sq Ft
1.08
Acres
About This Home
This home is located at 1010 N 3900 W, Fillmore, UT 84631 and is currently estimated at $323,682. 1010 N 3900 W is a home.
Ownership History
Date
Name
Owned For
Owner Type
Purchase Details
Closed on
Aug 9, 2010
Sold by
Robison Farms Lc
Bought by
Ellison Layne and Ellison Shantry
Current Estimated Value
Create a Home Valuation Report for This Property
The Home Valuation Report is an in-depth analysis detailing your home's value as well as a comparison with similar homes in the area
Home Values in the Area
Average Home Value in this Area
Purchase History
| Date | Buyer | Sale Price | Title Company |
|---|---|---|---|
| Ellison Layne | -- | -- |
Source: Public Records
Tax History Compared to Growth
Tax History
| Year | Tax Paid | Tax Assessment Tax Assessment Total Assessment is a certain percentage of the fair market value that is determined by local assessors to be the total taxable value of land and additions on the property. | Land | Improvement |
|---|---|---|---|---|
| 2025 | $230 | $30,551 | $6,000 | $24,551 |
| 2024 | $230 | $19,279 | $1,863 | $17,416 |
| 2023 | $193 | $19,279 | $1,863 | $17,416 |
| 2022 | $116 | $11,151 | $500 | $10,651 |
| 2021 | $124 | $11,463 | $500 | $10,963 |
| 2020 | $86 | $8,019 | $500 | $7,519 |
| 2019 | $85 | $8,024 | $505 | $7,519 |
| 2018 | $82 | $7,911 | $565 | $7,346 |
| 2017 | $86 | $7,918 | $572 | $7,346 |
| 2016 | $82 | $7,918 | $572 | $7,346 |
| 2015 | $71 | $6,924 | $0 | $6,924 |
| 2014 | -- | $6,955 | $0 | $6,955 |
| 2013 | -- | $6,991 | $0 | $6,991 |
Source: Public Records
Map
Nearby Homes
- 1360 N 3900 West Rd
- 7500 N 3900 Rd W
- 400 W 2600 North St
- 2000 N West Frontage I-15
- 3700 W 5800 N
- 205 N 100 E
- 410 W 400 N
- 1565 W Sunflower Ln Unit 3
- 1615 W Sunflower Ln
- 1615 W Sunflower Ln Unit 4
- 1565 W Sunflower Ln
- 335 W 400 North St
- 310 S 500 West Rd
- 1100 S 725 Rd W
- 225 W 200 St N
- 380 N 200 St W
- 295 N 100 West St
- 390 N 100 W
- 165 N 100 W
- 2155 N Cedar Mountain Rd