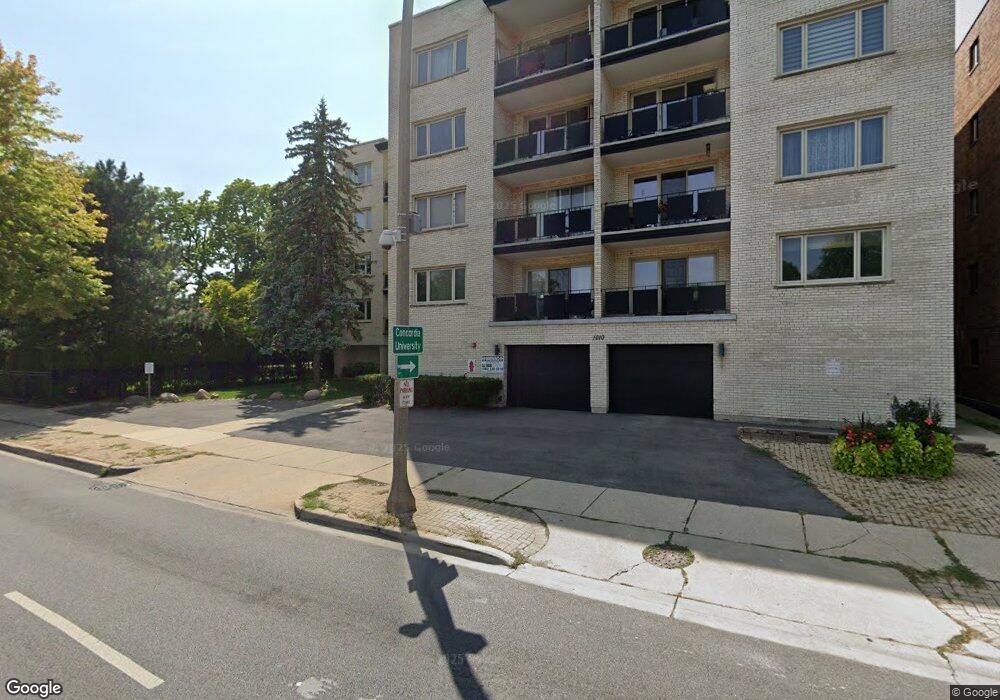
1010 N Harlem Ave Unit 503 River Forest, IL 60305
Estimated Value: $269,000 - $293,000
2
Beds
2
Baths
1,200
Sq Ft
$230/Sq Ft
Est. Value
About This Home
This home is located at 1010 N Harlem Ave Unit 503, River Forest, IL 60305 and is currently estimated at $276,500, approximately $230 per square foot. 1010 N Harlem Ave Unit 503 is a home located in Cook County with nearby schools including Willard Elementary School, Roosevelt Middle School, and Oak Park and River Forest High School.
Ownership History
Date
Name
Owned For
Owner Type
Purchase Details
Closed on
Aug 7, 2023
Sold by
Ibarra Enrique and Ibarra Gloria
Bought by
Tapia Dolores and Ibarra Enrique
Current Estimated Value
Purchase Details
Closed on
May 9, 2011
Sold by
Ganek Steve and Ganek Kim A
Bought by
Ibarra Enrique and Ibarra Gloria
Home Financials for this Owner
Home Financials are based on the most recent Mortgage that was taken out on this home.
Original Mortgage
$96,000
Interest Rate
4.88%
Mortgage Type
Unknown
Purchase Details
Closed on
Jun 29, 2006
Sold by
Ganek Steve and Ganek Bryan
Bought by
Ganek Steve and Ganek Kim A
Purchase Details
Closed on
Jun 7, 2006
Sold by
Delgiorno John F
Bought by
Ganek Steve and Ganek Bryan
Purchase Details
Closed on
Dec 21, 2001
Sold by
Harris Trust & Svgs Bank
Bought by
Basilio Joseph M
Purchase Details
Closed on
Jan 27, 2000
Sold by
Basilio Joseph M
Bought by
Harris Bank Hinsdale and Trust #L-3903
Create a Home Valuation Report for This Property
The Home Valuation Report is an in-depth analysis detailing your home's value as well as a comparison with similar homes in the area
Home Values in the Area
Average Home Value in this Area
Purchase History
| Date | Buyer | Sale Price | Title Company |
|---|---|---|---|
| Tapia Dolores | -- | Chicago Title Insurance Compan | |
| Ibarra Enrique | $120,000 | Chicago Title Insurance Co | |
| Ganek Steve | -- | None Available | |
| Ganek Steve | $205,000 | Chicago Title Insurance Co | |
| Basilio Joseph M | -- | -- | |
| Harris Bank Hinsdale | -- | -- |
Source: Public Records
Mortgage History
| Date | Status | Borrower | Loan Amount |
|---|---|---|---|
| Previous Owner | Ibarra Enrique | $96,000 |
Source: Public Records
Tax History Compared to Growth
Tax History
| Year | Tax Paid | Tax Assessment Tax Assessment Total Assessment is a certain percentage of the fair market value that is determined by local assessors to be the total taxable value of land and additions on the property. | Land | Improvement |
|---|---|---|---|---|
| 2024 | $5,866 | $21,429 | $1,309 | $20,120 |
| 2023 | $6,008 | $21,429 | $1,309 | $20,120 |
| 2022 | $6,008 | $18,606 | $1,287 | $17,319 |
| 2021 | $5,786 | $18,605 | $1,287 | $17,318 |
| 2020 | $5,653 | $18,605 | $1,287 | $17,318 |
| 2019 | $4,242 | $13,666 | $1,179 | $12,487 |
| 2018 | $4,016 | $13,666 | $1,179 | $12,487 |
| 2017 | $4,002 | $13,666 | $1,179 | $12,487 |
| 2016 | $4,443 | $13,810 | $986 | $12,824 |
| 2015 | $4,364 | $13,810 | $986 | $12,824 |
| 2014 | $3,998 | $13,810 | $986 | $12,824 |
| 2013 | $4,261 | $15,101 | $986 | $14,115 |
Source: Public Records
Map
Nearby Homes
- 1000 N Harlem Ave
- 1106 N Harlem Ave Unit 2
- 801 N Marion St
- 742 N Marion St
- 809 N Marion St
- 810 N Marion St
- 833 N Harlem Ave Unit 3S
- 1205 N Harlem Ave Unit 6
- 838 William St
- 7210 Oak Ave Unit 3SW
- 734 Bonnie Brae Place
- 420 N Marion St
- 411 N Marion St
- 7200 Oak Ave Unit 3NW
- 7200 Oak Ave Unit 4SW
- 7212 Oak Ave Unit 3NE
- 727 Clinton Place
- 723 N Kenilworth Ave
- 7202 Oak Ave Unit 4NE
- 922 Jackson Ave
- 1010 N Harlem Ave Unit 205
- 1010 N Harlem Ave Unit 401
- 1010 N Harlem Ave Unit 204
- 1010 N Harlem Ave Unit 501
- 1010 N Harlem Ave Unit 201
- 1010 N Harlem Ave Unit 302
- 1010 N Harlem Ave Unit 203
- 1010 N Harlem Ave Unit 502
- 1010 N Harlem Ave Unit 304
- 1010 N Harlem Ave Unit 402
- 1010 N Harlem Ave Unit 303
- 1010 N Harlem Ave Unit 202
- 1010 N Harlem Ave Unit 301
- 1010 N Harlem Ave Unit 404
- 1010 N Harlem Ave Unit 405
- 1010 N Harlem Ave Unit 403
- 1010 N Harlem Ave Unit 505
- 1010 N Harlem Ave Unit 504
- 1010 N Harlem Ave Unit 305
- 1010 N Harlem Ave