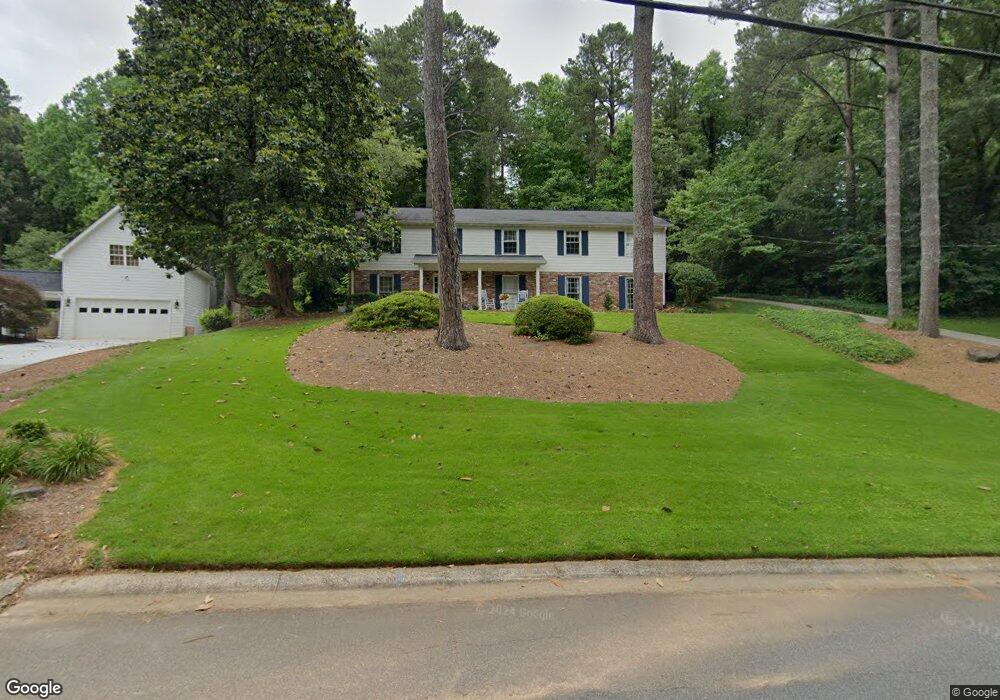
1010 N Point Dr Unit 1 Roswell, GA 30075
Estimated Value: $549,000 - $673,000
3
Beds
3
Baths
1,682
Sq Ft
$355/Sq Ft
Est. Value
About This Home
This home is located at 1010 N Point Dr Unit 1, Roswell, GA 30075 and is currently estimated at $597,910, approximately $355 per square foot. 1010 N Point Dr Unit 1 is a home located in Fulton County with nearby schools including Roswell North Elementary School, Crabapple Middle School, and High Meadows School.
Ownership History
Date
Name
Owned For
Owner Type
Purchase Details
Closed on
Jan 10, 2020
Sold by
Hobbs Martha A
Bought by
Hobbs Martha A and Hobbs Christopher G
Current Estimated Value
Purchase Details
Closed on
Aug 18, 1994
Sold by
Lynch Thomas H Mary B
Bought by
Hobbs Christopher Martha
Home Financials for this Owner
Home Financials are based on the most recent Mortgage that was taken out on this home.
Original Mortgage
$109,400
Interest Rate
8.37%
Create a Home Valuation Report for This Property
The Home Valuation Report is an in-depth analysis detailing your home's value as well as a comparison with similar homes in the area
Home Values in the Area
Average Home Value in this Area
Purchase History
| Date | Buyer | Sale Price | Title Company |
|---|---|---|---|
| Hobbs Martha A | -- | -- | |
| Hobbs Christopher Martha | $136,800 | -- |
Source: Public Records
Mortgage History
| Date | Status | Borrower | Loan Amount |
|---|---|---|---|
| Previous Owner | Hobbs Christopher Martha | $109,400 |
Source: Public Records
Tax History Compared to Growth
Tax History
| Year | Tax Paid | Tax Assessment Tax Assessment Total Assessment is a certain percentage of the fair market value that is determined by local assessors to be the total taxable value of land and additions on the property. | Land | Improvement |
|---|---|---|---|---|
| 2025 | $621 | $177,600 | $40,760 | $136,840 |
| 2023 | $4,791 | $169,720 | $35,400 | $134,320 |
| 2022 | $2,203 | $169,720 | $35,400 | $134,320 |
| 2021 | $2,666 | $156,640 | $31,640 | $125,000 |
| 2020 | $2,696 | $139,720 | $30,600 | $109,120 |
| 2019 | $489 | $128,080 | $22,640 | $105,440 |
| 2018 | $2,944 | $125,120 | $22,120 | $103,000 |
| 2017 | $2,426 | $95,080 | $16,080 | $79,000 |
| 2016 | $2,424 | $95,080 | $16,080 | $79,000 |
| 2015 | $2,953 | $95,080 | $16,080 | $79,000 |
| 2014 | $2,524 | $95,080 | $16,080 | $79,000 |
Source: Public Records
Map
Nearby Homes
- 9480 Coleman Rd
- 9650 Coleman Rd
- 830 Willeo Rd
- 8035 Sandorn Dr
- 657 Willeo Rd
- 1215 Ridgefield Dr
- 8075 Sandorn Dr
- 9705 Coleman Rd
- 135 Grayton Ln
- 175 Grayton Ln
- 9035 Sandorn Dr
- 2130 Federal Rd Unit II
- 605 Ga 120 Hwy
- 145 Grayton Ln
- 355 Highlands Trace
- 130 Farm Hill Cir
- 325 Farm Trace
- 300 Farm Track Unit 3
- 1020 N Point Dr
- 9490 Coleman Rd
- 9500 Coleman Rd
- 1030 N Point Dr Unit 1
- N N Point Dr
- 1025 N Point Dr
- 9470 Coleman Rd
- 9460 Coleman Rd
- 1100 Orchard Way
- 1045 N Point Dr
- 9450 Coleman Rd
- 1110 Orchard Way
- 900 Willeo Rd
- 1075 N Point Dr
- 800 Willeo Rd
- 9448 Coleman Rd
- 1120 Orchard Way
- 9505 Coleman Rd
- 1115 Orchard Way Unit 1
- 0 N Point Dr Unit 7151236