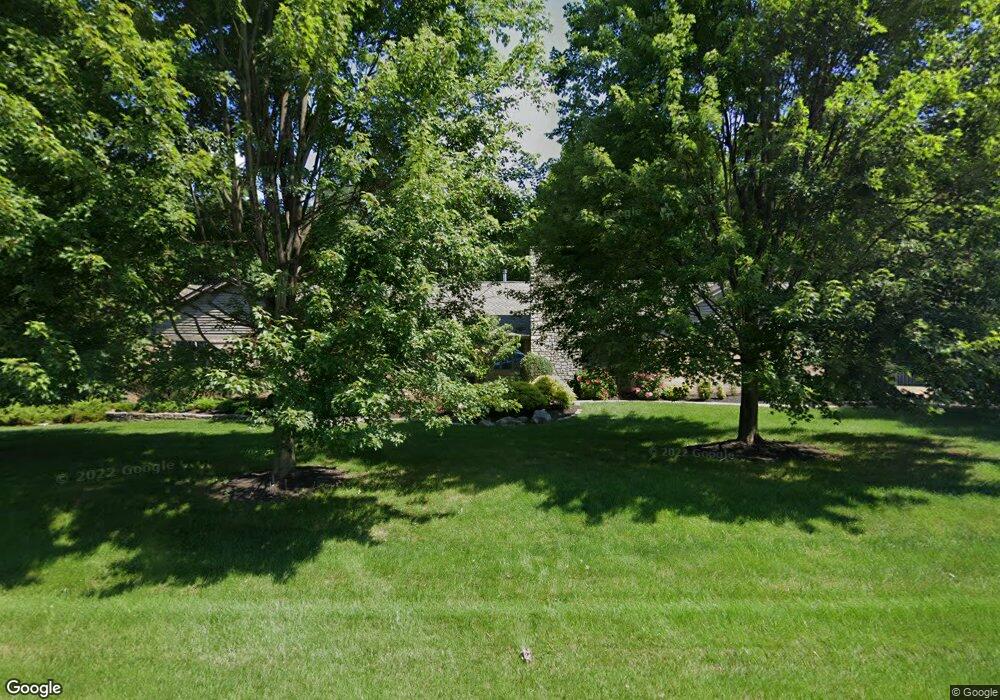
1010 Notchbrook Dr Delaware, OH 43015
Liberty Township NeighborhoodEstimated Value: $901,000 - $1,141,000
4
Beds
4
Baths
3,800
Sq Ft
$268/Sq Ft
Est. Value
About This Home
This home is located at 1010 Notchbrook Dr, Delaware, OH 43015 and is currently estimated at $1,019,427, approximately $268 per square foot. 1010 Notchbrook Dr is a home located in Delaware County with nearby schools including Heritage Elementary School, Olentangy Shanahan Middle School, and Olentangy High School.
Ownership History
Date
Name
Owned For
Owner Type
Purchase Details
Closed on
Aug 11, 2009
Sold by
Metro Properties Inc
Bought by
Torma James A and Torma Jacqueline J
Current Estimated Value
Home Financials for this Owner
Home Financials are based on the most recent Mortgage that was taken out on this home.
Original Mortgage
$307,500
Interest Rate
4.79%
Mortgage Type
Purchase Money Mortgage
Purchase Details
Closed on
Mar 12, 2009
Sold by
Hakim Joe and Hakim Joe K
Bought by
Metro Properties Inc
Home Financials for this Owner
Home Financials are based on the most recent Mortgage that was taken out on this home.
Original Mortgage
$334,000
Interest Rate
5.11%
Mortgage Type
New Conventional
Purchase Details
Closed on
Jan 12, 2009
Sold by
Allan David W and Allan Ann R
Bought by
Hakim Joe
Home Financials for this Owner
Home Financials are based on the most recent Mortgage that was taken out on this home.
Original Mortgage
$334,000
Interest Rate
5.11%
Mortgage Type
New Conventional
Create a Home Valuation Report for This Property
The Home Valuation Report is an in-depth analysis detailing your home's value as well as a comparison with similar homes in the area
Home Values in the Area
Average Home Value in this Area
Purchase History
| Date | Buyer | Sale Price | Title Company |
|---|---|---|---|
| Torma James A | $457,500 | Preferred Title | |
| Metro Properties Inc | -- | Preferred Title | |
| Hakim Joe | $274,100 | Attorney |
Source: Public Records
Mortgage History
| Date | Status | Borrower | Loan Amount |
|---|---|---|---|
| Closed | Torma James A | $307,500 | |
| Previous Owner | Metro Properties Inc | $334,000 |
Source: Public Records
Tax History Compared to Growth
Tax History
| Year | Tax Paid | Tax Assessment Tax Assessment Total Assessment is a certain percentage of the fair market value that is determined by local assessors to be the total taxable value of land and additions on the property. | Land | Improvement |
|---|---|---|---|---|
| 2024 | $14,208 | $270,690 | $60,760 | $209,930 |
| 2023 | $14,264 | $270,690 | $60,760 | $209,930 |
| 2022 | $14,733 | $221,620 | $58,240 | $163,380 |
| 2021 | $14,824 | $221,620 | $58,240 | $163,380 |
| 2020 | $14,895 | $221,620 | $58,240 | $163,380 |
| 2019 | $11,559 | $179,240 | $48,550 | $130,690 |
| 2018 | $11,613 | $179,240 | $48,550 | $130,690 |
| 2017 | $11,492 | $157,960 | $41,340 | $116,620 |
| 2016 | $10,894 | $157,960 | $41,340 | $116,620 |
| 2015 | $9,854 | $157,960 | $41,340 | $116,620 |
| 2014 | $9,990 | $157,960 | $41,340 | $116,620 |
| 2013 | $10,222 | $157,960 | $41,340 | $116,620 |
Source: Public Records
Map
Nearby Homes
- 780 Home Rd
- 310 Waterside Dr Unit 11310
- 306 Waterside Dr Unit 11306
- 294 Waterside Dr Unit 12294
- 328 Restoration Dr
- 288 Harness Way
- 243 Parkgate Ct
- 6941 Star Hollow Ln
- 170 Daymark Dr
- 8032 Wingate Place
- 0 Gooding Blvd Unit LOT D 222032731
- 0 Gooding Blvd Unit LOT C 222032727
- 0 Gooding Blvd Unit LOT A 222032706
- 0 Gooding Blvd Unit LOT B 222032713
- 107 Corduroy Rd
- 7424 Gooding Blvd
- 210 Tinley Park Cir Unit 210
- 1453 Wren Ln
- 144 Tinley Park Cir
- 1650 Wren Ln
- 979 Notchbrook Dr
- 1025 Notchbrook Dr
- 930 Notchbrook Dr
- 925 Notchbrook Dr
- 1077 Notchbrook Dr
- 888 Notchbrook Dr
- 889 Notchbrook Dr
- 850 Notchbrook Dr
- 7525 Perry Rd
- 1100 Notchbrook Dr
- 7385 Perry Rd
- 7626 Perry Rd
- 855 Notchbrook Dr
- 7355 Perry Rd
- 818 Notchbrook Dr
- 7601 Perry Rd
- 7585 Perry Rd
- 7595 Perry Rd
- 7375 Perry Rd
- 789 Notchbrook Dr