1010 Okelly Rd Clarkesville, GA 30523
Estimated Value: $606,332 - $815,000
3
Beds
2
Baths
2,717
Sq Ft
$256/Sq Ft
Est. Value
About This Home
This home is located at 1010 Okelly Rd, Clarkesville, GA 30523 and is currently estimated at $696,333, approximately $256 per square foot. 1010 Okelly Rd is a home located in Habersham County with nearby schools including Clarkesville Elementary School, North Habersham Middle School, and Habersham Success Academy.
Ownership History
Date
Name
Owned For
Owner Type
Purchase Details
Closed on
Nov 8, 2019
Sold by
Roberts Holly
Bought by
Roberts Holly and Berry Abigail
Current Estimated Value
Home Financials for this Owner
Home Financials are based on the most recent Mortgage that was taken out on this home.
Original Mortgage
$307,020
Outstanding Balance
$272,366
Interest Rate
4.4%
Mortgage Type
FHA
Estimated Equity
$423,967
Purchase Details
Closed on
Dec 10, 2014
Sold by
Robert Holly
Bought by
Strait Elizabeth Higgins
Purchase Details
Closed on
Sep 12, 2014
Sold by
Berry Holly
Bought by
Gosnell Rodney C
Purchase Details
Closed on
Apr 15, 2011
Sold by
Berry Holly
Bought by
Berry Stacy
Purchase Details
Closed on
Mar 1, 2008
Sold by
Not Provided
Bought by
Berry Holly
Purchase Details
Closed on
Aug 1, 2007
Sold by
Not Provided
Bought by
Berry Holly
Purchase Details
Closed on
Jun 1, 2007
Sold by
Not Provided
Bought by
Berry Holly
Create a Home Valuation Report for This Property
The Home Valuation Report is an in-depth analysis detailing your home's value as well as a comparison with similar homes in the area
Home Values in the Area
Average Home Value in this Area
Purchase History
| Date | Buyer | Sale Price | Title Company |
|---|---|---|---|
| Roberts Holly | -- | -- | |
| Strait Elizabeth Higgins | -- | -- | |
| Gosnell Rodney C | $50,000 | -- | |
| Berry Stacy | -- | -- | |
| Berry Holly | -- | -- | |
| Berry Holly | -- | -- | |
| Berry Holly | -- | -- |
Source: Public Records
Mortgage History
| Date | Status | Borrower | Loan Amount |
|---|---|---|---|
| Open | Roberts Holly | $307,020 |
Source: Public Records
Tax History Compared to Growth
Tax History
| Year | Tax Paid | Tax Assessment Tax Assessment Total Assessment is a certain percentage of the fair market value that is determined by local assessors to be the total taxable value of land and additions on the property. | Land | Improvement |
|---|---|---|---|---|
| 2025 | $3,930 | $222,115 | $23,240 | $198,875 |
| 2024 | -- | $247,068 | $15,124 | $231,944 |
| 2023 | $3,654 | $206,424 | $15,124 | $191,300 |
| 2022 | $3,901 | $176,424 | $12,736 | $163,688 |
| 2021 | $3,721 | $160,648 | $12,736 | $147,912 |
| 2020 | $3,521 | $137,928 | $11,144 | $126,784 |
| 2019 | $3,524 | $137,928 | $11,144 | $126,784 |
| 2018 | $3,500 | $137,928 | $11,144 | $126,784 |
| 2017 | $3,329 | $125,880 | $11,144 | $114,736 |
| 2016 | $3,230 | $314,700 | $11,144 | $114,736 |
| 2015 | $3,285 | $326,530 | $15,876 | $114,736 |
| 2014 | $2,927 | $283,760 | $37,304 | $110,988 |
| 2013 | -- | $148,292 | $37,304 | $110,988 |
Source: Public Records
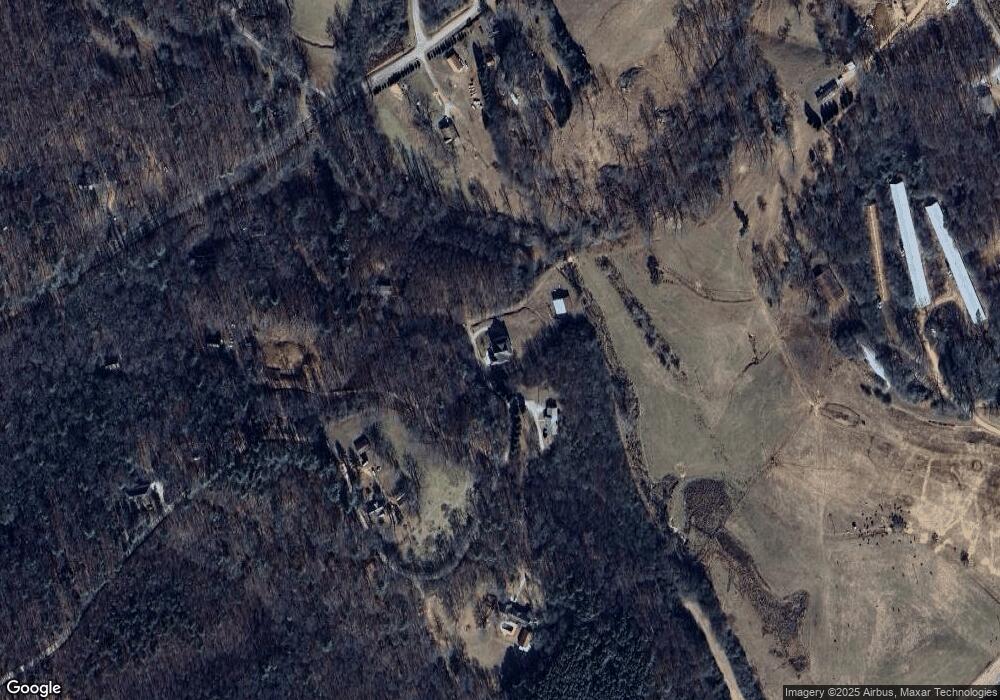
Map
Nearby Homes
- 124 Rockford Farm Dr
- 712 Meadow Run Ct
- LOT 2 Hollywood Church Rd
- LOT 3 Hollywood Church Rd
- LOT 4 Hollywood Church Rd
- 766 Hollywood Church Rd
- LOT 1 Hollywood Church Rd
- 2085 Buckhorn Rd
- 281 Grindstone Creek Dr
- 501 the Orchard Rd
- 0 Buckhorn Rd Unit 10556339
- 274 Hardman Rd
- 182 Hardman Rd
- 253 Grindstone Creek Dr
- 0 TRACT 4 Annandale Dr
- 0 TRACT 3 Annandale Dr
- 0 TRACT 1 Annandale Dr
- 0 TRACT 2 Annandale Dr
- 281 Grindstone Creek Dr
- 399 Grindstone Creek Dr
- 1010 Okelly Rd
- 1000 Okelly Rd
- 1021 Okelly Rd
- 693 Okelly Rd
- 693 Okelly Rd
- 558 Frank Lovell Rd
- 122 MacK Eller Rd
- 992 Okelly Rd
- 144 MacK Eller Rd
- 400 Frank Lovell Rd
- 400 Frank Lovell Rd
- 270 Frank Lovell Rd
- 355 Okelly Rd
- 335 Frank Lovell Rd
- 391 Frank Lovell Rd
- 481 Frank Lovell Rd
- 350 Mar Mac Farm Rd
- 265 Frank Lovell Rd
- 841 Frank Lovell Rd
- 39 Kelly Mountain Rd