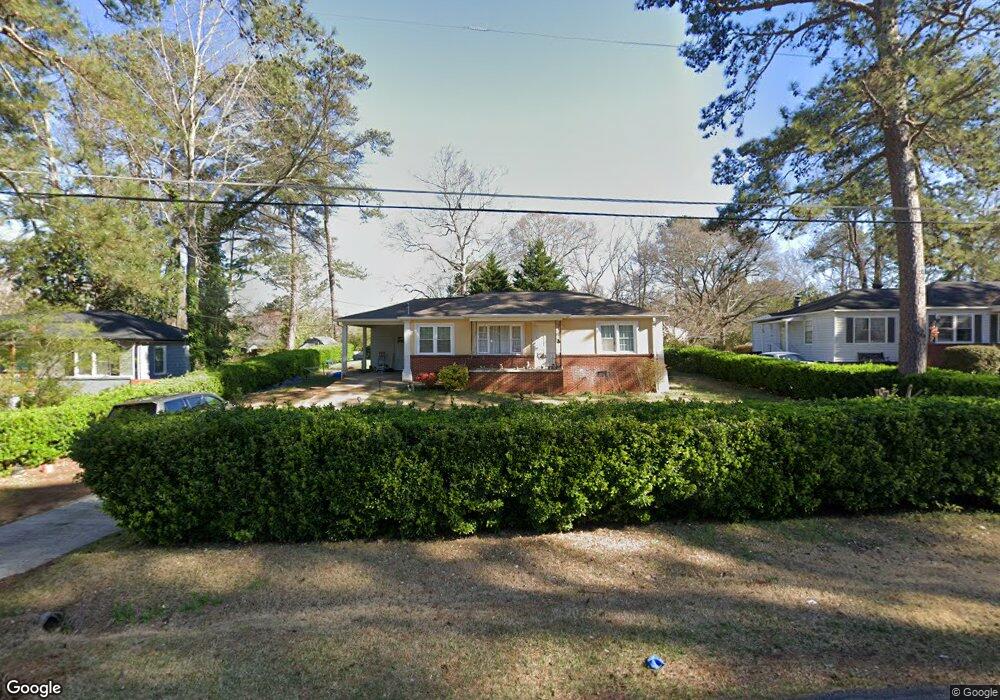
1010 Pine Forest Dr SW Mableton, GA 30126
Estimated Value: $199,000 - $233,000
2
Beds
1
Bath
960
Sq Ft
$225/Sq Ft
Est. Value
About This Home
This home is located at 1010 Pine Forest Dr SW, Mableton, GA 30126 and is currently estimated at $216,018, approximately $225 per square foot. 1010 Pine Forest Dr SW is a home located in Cobb County with nearby schools including Mableton Elementary School, Floyd Middle School, and Connection Pointe Christian Academy.
Ownership History
Date
Name
Owned For
Owner Type
Purchase Details
Closed on
Feb 2, 2010
Sold by
Bac Home Loans Servicing Lp
Bought by
Federal Natl Mtg Assn Fnma
Current Estimated Value
Purchase Details
Closed on
May 30, 2003
Sold by
Hud-Housing Of Urban Development
Bought by
Butler Matthew R and Butler Jennifer
Home Financials for this Owner
Home Financials are based on the most recent Mortgage that was taken out on this home.
Original Mortgage
$88,800
Interest Rate
5.52%
Purchase Details
Closed on
Sep 3, 2002
Sold by
First Horizon Home Loan Corp
Bought by
Sec Of Hud
Purchase Details
Closed on
Aug 25, 2000
Sold by
Harrington Leslie D
Bought by
Wright Willie C and Wright Erra L
Home Financials for this Owner
Home Financials are based on the most recent Mortgage that was taken out on this home.
Original Mortgage
$87,900
Interest Rate
8.07%
Mortgage Type
FHA
Purchase Details
Closed on
May 10, 1996
Sold by
Gordon Bobby L
Bought by
Harrington Leslie D
Create a Home Valuation Report for This Property
The Home Valuation Report is an in-depth analysis detailing your home's value as well as a comparison with similar homes in the area
Home Values in the Area
Average Home Value in this Area
Purchase History
| Date | Buyer | Sale Price | Title Company |
|---|---|---|---|
| Federal Natl Mtg Assn Fnma | -- | -- | |
| Bac Home Loans Servicing Lp | $83,701 | -- | |
| Butler Matthew R | -- | -- | |
| Sec Of Hud | -- | -- | |
| First Horizon Home Loan Corp | $100,557 | -- | |
| Wright Willie C | $88,400 | -- | |
| Harrington Leslie D | $59,000 | -- |
Source: Public Records
Mortgage History
| Date | Status | Borrower | Loan Amount |
|---|---|---|---|
| Previous Owner | Butler Matthew R | $88,800 | |
| Previous Owner | Wright Willie C | $87,900 | |
| Closed | Harrington Leslie D | $0 |
Source: Public Records
Tax History Compared to Growth
Tax History
| Year | Tax Paid | Tax Assessment Tax Assessment Total Assessment is a certain percentage of the fair market value that is determined by local assessors to be the total taxable value of land and additions on the property. | Land | Improvement |
|---|---|---|---|---|
| 2025 | $2,200 | $73,028 | $26,000 | $47,028 |
| 2024 | $2,202 | $73,028 | $26,000 | $47,028 |
| 2023 | $2,259 | $74,928 | $14,000 | $60,928 |
| 2022 | $1,550 | $51,084 | $12,000 | $39,084 |
| 2021 | $1,550 | $51,084 | $12,000 | $39,084 |
| 2020 | $1,264 | $41,652 | $8,000 | $33,652 |
| 2019 | $975 | $32,136 | $7,200 | $24,936 |
| 2018 | $780 | $25,712 | $7,200 | $18,512 |
| 2017 | $658 | $22,880 | $6,000 | $16,880 |
| 2016 | $509 | $17,708 | $6,000 | $11,708 |
| 2015 | $236 | $8,000 | $4,048 | $3,952 |
| 2014 | $238 | $8,000 | $0 | $0 |
Source: Public Records
Map
Nearby Homes
- 4397 Treadle Rd SW
- 4976 Mable Lake Dr SW
- 1047 Retner Dr SW
- 1056 Retner Dr SW Unit 3
- 854 Joseph Club Dr SW
- 1180 Deborah Dr SW
- 4973 White Blvd SW
- 5205 Silhouette Ln SW
- 875 Joseph Club Dr SW
- 4938 White Blvd SW
- 1275 Clay Rd SW
- 1305 Belle Meade Cir SW
- 4167 Waratah Way
- 5341 Old Floyd Rd SW
- 0 Brookwood Dr Unit 7577066
- 0 Brookwood Dr Unit 10519191
- 8009 Haven Springs Trace
- 8021 Haven Springs Trace
- 8012 Haven Springs Trace
- 8029 Haven Springs Trace
- 1000 Pine Forest Dr SW
- 1020 Pine Forest Dr SW
- 4398 Treadle Rd SW
- 4272 Tin Hare Ln SW
- 4262 Tin Hare Ln SW
- 4273 Tin Hare Ln SW
- 4254 Tin Hare Ln SW
- 4257 Tin Hare Ln SW
- 4261 Tin Hare Ln SW
- 4265 Tin Hare Ln SW
- 4241 Tin Hare Ln SW
- 4233 Tin Hare Ln SW
- 4393 Treadle Rd SW
- 4374 Treadle Rd SW
- 4382 Treadle Rd SW
- 4394 Treadle Rd SW
- 4287 Tin Hare Ln SW
- 1011 Dale Dr SW
- 990 Pine Forest Dr SW
- 1001 Dale Dr SW