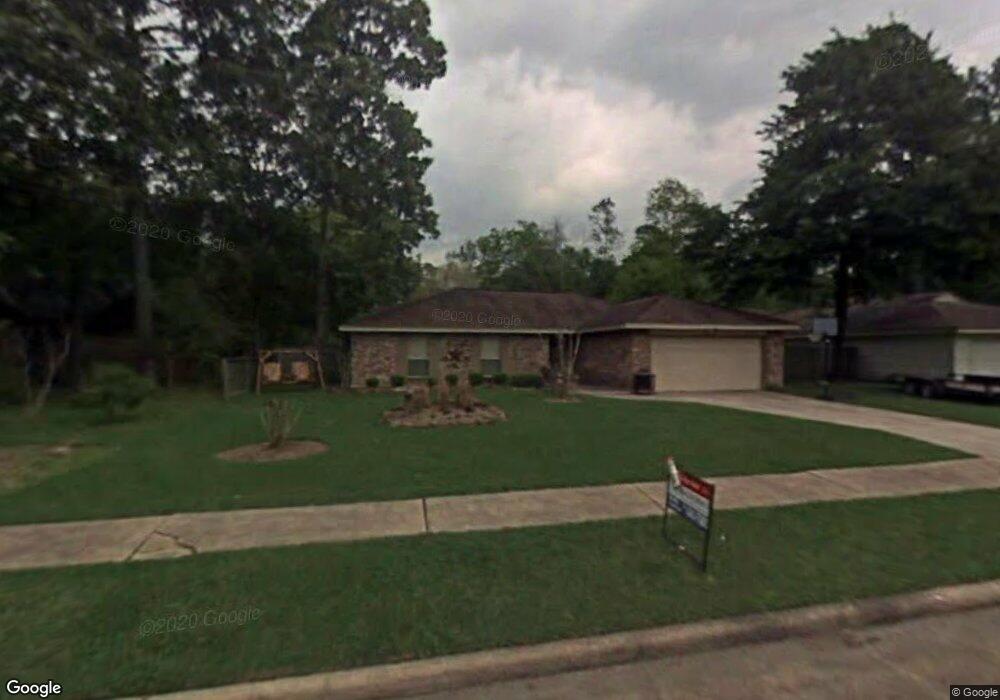
1010 Poppets Way Crosby, TX 77532
Estimated Value: $229,000 - $254,000
4
Beds
2
Baths
1,814
Sq Ft
$134/Sq Ft
Est. Value
About This Home
This home is located at 1010 Poppets Way, Crosby, TX 77532 and is currently estimated at $242,575, approximately $133 per square foot. 1010 Poppets Way is a home located in Harris County with nearby schools including Crosby Elementary School, Crosby Middle School, and Crosby High School.
Ownership History
Date
Name
Owned For
Owner Type
Purchase Details
Closed on
Apr 23, 2015
Sold by
Fannie Mae
Bought by
Conklin Michael G
Current Estimated Value
Home Financials for this Owner
Home Financials are based on the most recent Mortgage that was taken out on this home.
Original Mortgage
$117,114
Outstanding Balance
$90,581
Interest Rate
3.87%
Mortgage Type
FHA
Estimated Equity
$151,994
Purchase Details
Closed on
Apr 21, 2008
Sold by
Cosper Donald L and Mendoza Maria
Bought by
Fnma
Home Financials for this Owner
Home Financials are based on the most recent Mortgage that was taken out on this home.
Original Mortgage
$108,965
Interest Rate
6.11%
Mortgage Type
Purchase Money Mortgage
Purchase Details
Closed on
Nov 24, 2003
Sold by
Pannabecker David E and Pannabecker Judy F
Bought by
Shaver David N and Shaver Rachel L
Home Financials for this Owner
Home Financials are based on the most recent Mortgage that was taken out on this home.
Original Mortgage
$90,022
Interest Rate
6.01%
Mortgage Type
Purchase Money Mortgage
Create a Home Valuation Report for This Property
The Home Valuation Report is an in-depth analysis detailing your home's value as well as a comparison with similar homes in the area
Home Values in the Area
Average Home Value in this Area
Purchase History
| Date | Buyer | Sale Price | Title Company |
|---|---|---|---|
| Conklin Michael G | -- | None Available | |
| Fnma | $90,645 | None Available | |
| Cosper Donald E | -- | Great American Title Company | |
| Shaver David N | -- | First American Title |
Source: Public Records
Mortgage History
| Date | Status | Borrower | Loan Amount |
|---|---|---|---|
| Open | Conklin Michael G | $117,114 | |
| Previous Owner | Cosper Donald E | $108,965 | |
| Previous Owner | Shaver David N | $90,022 |
Source: Public Records
Tax History Compared to Growth
Tax History
| Year | Tax Paid | Tax Assessment Tax Assessment Total Assessment is a certain percentage of the fair market value that is determined by local assessors to be the total taxable value of land and additions on the property. | Land | Improvement |
|---|---|---|---|---|
| 2025 | $4,303 | $230,856 | $50,608 | $180,248 |
| 2024 | $4,303 | $223,637 | $50,608 | $173,029 |
| 2023 | $4,303 | $232,490 | $50,608 | $181,882 |
| 2022 | $5,437 | $207,038 | $50,608 | $156,430 |
| 2021 | $4,740 | $174,874 | $36,806 | $138,068 |
| 2020 | $4,385 | $155,487 | $36,806 | $118,681 |
| 2019 | $4,797 | $162,964 | $27,604 | $135,360 |
| 2018 | $2,332 | $141,341 | $13,802 | $127,539 |
| 2017 | $4,125 | $137,310 | $13,802 | $123,508 |
| 2016 | $4,125 | $137,310 | $13,802 | $123,508 |
| 2015 | $3,436 | $137,310 | $13,802 | $123,508 |
| 2014 | $3,436 | $114,241 | $11,042 | $103,199 |
Source: Public Records
Map
Nearby Homes
- 15903 Castaway Ct
- 15918 Tug Ct
- 914 Companion Dr
- 15902 Boatswain Ct
- 15907 Castaway Ct
- 1211 Poppets Way
- 15942 Boom Dr
- 15935 Boom Dr
- 930 S Chamfer Way
- 16006 Dockside St
- 16007 Dockside St
- 931 S Chamfer Way
- 914 S Chamfer Way
- 706 S Diamondhead Blvd
- 1004 Breech Dr
- 1006 Breech Dr
- 907 S Chamfer Way
- 912 Breech Dr
- 542 Oporto Path
- 1310 Tanner Dell Dr
- 1014 Poppets Way
- 1006 Poppets Way
- 931 S Diamondhead Blvd
- 1003 S Diamondhead Blvd
- 927 S Diamondhead Blvd
- 931 Diamondhead Bl
- 1018 Poppets Way
- 15811 Taut Ct
- 1002 Poppets Way
- 923 S Diamondhead Blvd
- 1007 S Diamondhead Blvd
- 15810 Toggle Ct
- 15810 Taut Ct
- 1022 Poppets Way
- 922 Poppets Way
- 1011 S Diamondhead Blvd
- 919 S Diamondhead Blvd
- 15807 Taut Ct
- 927 Poppets Way
- 15806 Toggle Ct