1010 Scott Loop Unit 16 Greensboro, GA 30642
Estimated Value: $2,756,000 - $3,248,000
4
Beds
5
Baths
3,502
Sq Ft
$868/Sq Ft
Est. Value
About This Home
This home is located at 1010 Scott Loop Unit 16, Greensboro, GA 30642 and is currently estimated at $3,040,324, approximately $868 per square foot. 1010 Scott Loop Unit 16 is a home located in Greene County with nearby schools including Greene County High School.
Ownership History
Date
Name
Owned For
Owner Type
Purchase Details
Closed on
Apr 15, 2016
Sold by
Farrell Wisnews Maureen
Bought by
Will Jean B
Current Estimated Value
Purchase Details
Closed on
Jul 21, 2008
Sold by
Wisnewski Steven R
Bought by
Wisnewski Steven & Maureen F Trustees
Purchase Details
Closed on
Jun 17, 2008
Sold by
Wisnewski Steven
Bought by
Maureen Farrell-Wisnewski Revo
Purchase Details
Closed on
Mar 11, 2002
Sold by
Wisnewski Steven R and Wisnewski Maureen
Bought by
Wisnewski Steven R
Purchase Details
Closed on
Jun 13, 1997
Sold by
Martin Paul E and Martin Jill S
Bought by
Wisnewski Steven R and Wisnewski Maureen
Purchase Details
Closed on
Oct 17, 1994
Sold by
Terhorse Jerald F and Terhorse Louise R
Bought by
Martin Paul E and Martin Jill S
Purchase Details
Closed on
Aug 24, 1992
Sold by
Mixon Mixon G and Mixon Dorcas S
Bought by
Terhorse Jerald F and Terhorse Louise R
Purchase Details
Closed on
Jan 1, 1988
Sold by
Linger Longer Dev
Bought by
Mixon Mixon G and Mixon Dorcas S
Purchase Details
Closed on
Jan 1, 1987
Bought by
Linger Longer Dev
Create a Home Valuation Report for This Property
The Home Valuation Report is an in-depth analysis detailing your home's value as well as a comparison with similar homes in the area
Home Values in the Area
Average Home Value in this Area
Purchase History
| Date | Buyer | Sale Price | Title Company |
|---|---|---|---|
| Will Jean B | $430,000 | -- | |
| Wisnewski Steven & Maureen F Trustees | -- | -- | |
| Maureen Farrell-Wisnewski Revo | $850,000 | -- | |
| Wisnewski Steven R | -- | -- | |
| Wisnewski Steven R | $229,000 | -- | |
| Martin Paul E | $148,000 | -- | |
| Terhorse Jerald F | $125,000 | -- | |
| Mixon Mixon G | $74,000 | -- | |
| Linger Longer Dev | -- | -- |
Source: Public Records
Tax History Compared to Growth
Tax History
| Year | Tax Paid | Tax Assessment Tax Assessment Total Assessment is a certain percentage of the fair market value that is determined by local assessors to be the total taxable value of land and additions on the property. | Land | Improvement |
|---|---|---|---|---|
| 2024 | $8,732 | $1,016,320 | $377,800 | $638,520 |
| 2023 | $8,460 | $993,400 | $377,800 | $615,600 |
| 2022 | $10,072 | $754,440 | $195,320 | $559,120 |
| 2021 | $10,727 | $709,040 | $195,320 | $513,720 |
| 2020 | $11,849 | $555,400 | $180,000 | $375,400 |
| 2019 | $12,033 | $555,400 | $180,000 | $375,400 |
| 2018 | $3,887 | $180,000 | $180,000 | $0 |
| 2017 | $3,488 | $180,000 | $180,000 | $0 |
| 2016 | $3,650 | $180,000 | $180,000 | $0 |
| 2015 | $3,938 | $198,000 | $198,000 | $0 |
| 2014 | $4,042 | $198,000 | $198,000 | $0 |
Source: Public Records
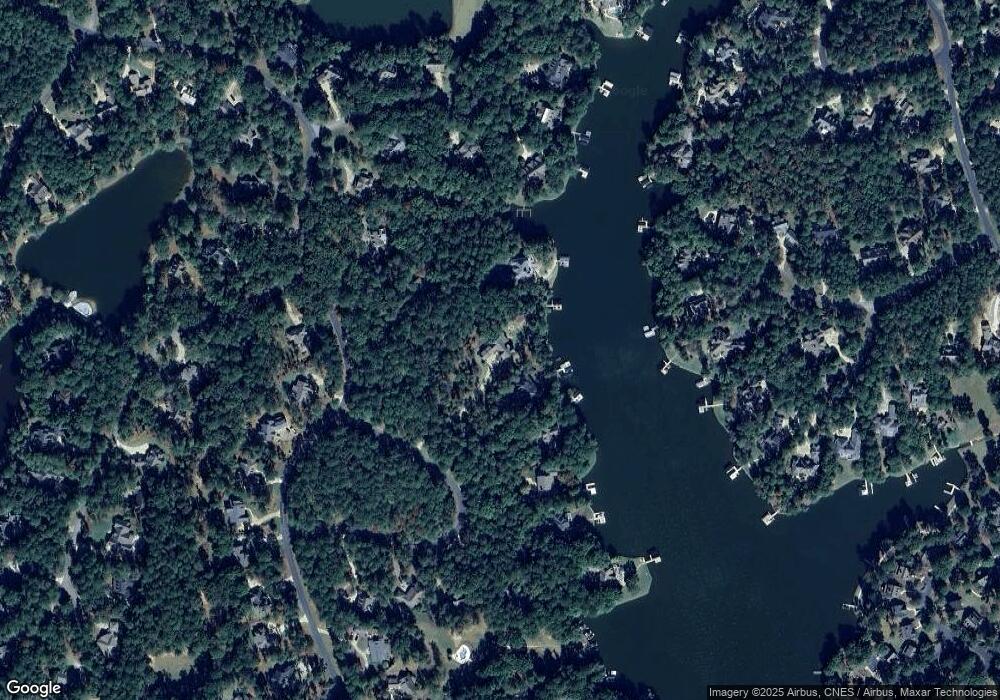
Map
Nearby Homes
- 1030 Scott Loop
- 1011 Penfield Way
- 1231 Bennett Springs Dr
- 1181 Bennett Springs Dr
- 1441 Bennett Springs Dr
- 1030 Yazoo Fishery
- 1201 Marina Cove Ln
- 1031 Crackers Neck Rd
- 1051 Maddux Ln
- 1121 Crackers Neck Rd
- 1101 Timothy Rd
- 1020 Tallesse Trail
- 1060 Dejarnet Place
- 1341 Planters Trail
- 1071 Eaglewood Way
- 1011 Kimbrough Hill Dr
- 1010 Wrayswood Cir
- 1010 Kimbrough Hill Dr
- 1041 Cawthorne Ln
- 1010 Scott Loop
- 1020 Scott Loop
- 0 Scott Loop Unit 8549578
- 0 Scott Loop Unit 9049461
- 0 Scott Loop Unit 7581513
- 0 Scott Loop
- 1280 Bennett Springs Dr
- 1040 Scott Loop
- 1290 Bennett Springs Dr
- 1071 Scott Loop
- 1311 Bennett Springs Dr
- 1260 Bennett Springs Dr
- 1010 Penfield Way
- 1060 Scott Loop
- 1321 Bennett Springs Dr Unit 73
- 1321 Bennett Springs Dr
- 0 Bennett Springs Dr Unit 7606358
- 0 Bennett Springs Dr Unit 8668079
- 0 Bennett Springs Dr Unit 8545339
- 0 Bennett Springs Dr Unit 8439353