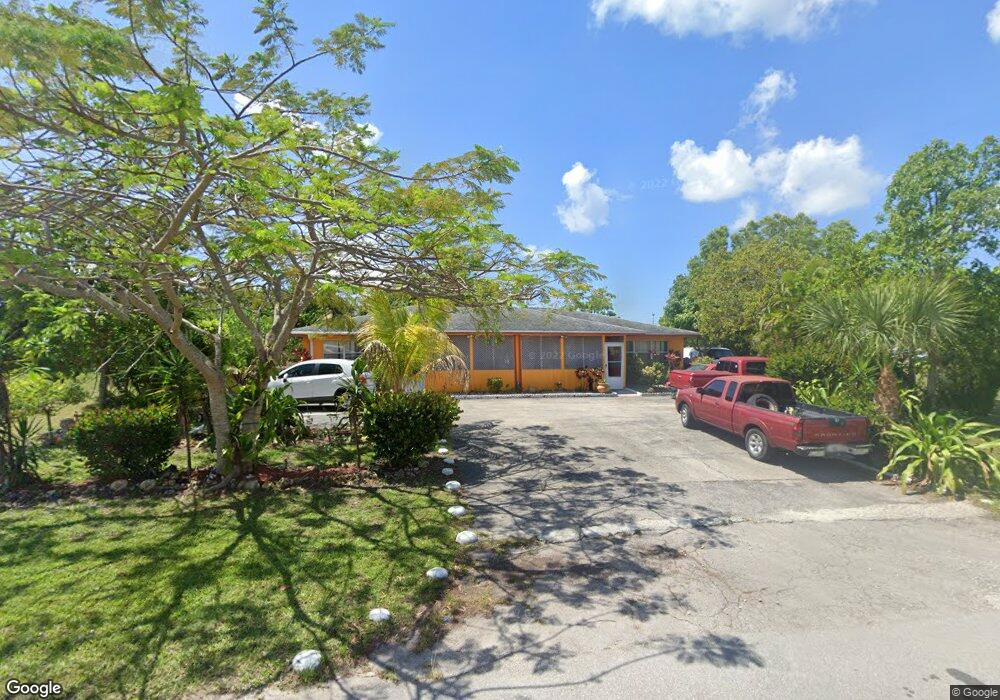
1010 SE 8th Terrace Cape Coral, FL 33990
Hancock NeighborhoodEstimated Value: $270,166 - $463,000
4
Beds
4
Baths
2,048
Sq Ft
$180/Sq Ft
Est. Value
About This Home
This home is located at 1010 SE 8th Terrace, Cape Coral, FL 33990 and is currently estimated at $369,292, approximately $180 per square foot. 1010 SE 8th Terrace is a home with nearby schools including Caloosa Elementary School, Tropic Isles Elementary School, and Hancock Creek Elementary School.
Ownership History
Date
Name
Owned For
Owner Type
Purchase Details
Closed on
Mar 11, 2019
Sold by
Constanza Francisco
Bought by
Constanza Francisco and Castellanos Silvia Yaneth Constanza
Current Estimated Value
Purchase Details
Closed on
Jun 21, 2005
Sold by
Lazano Romulo and Lazano Bertha
Bought by
Constanza Francisco
Home Financials for this Owner
Home Financials are based on the most recent Mortgage that was taken out on this home.
Original Mortgage
$190,400
Outstanding Balance
$117,338
Interest Rate
8.7%
Mortgage Type
Commercial
Estimated Equity
$251,954
Purchase Details
Closed on
Jun 17, 2002
Sold by
Smith Dale N and Smith Marie E
Bought by
Lazano Romulo and Lazano Bertha
Purchase Details
Closed on
May 14, 1998
Sold by
First Timothy W and Klein Ronald E
Bought by
Smith Dale N and Smith Marie E
Home Financials for this Owner
Home Financials are based on the most recent Mortgage that was taken out on this home.
Original Mortgage
$50,000
Interest Rate
7.1%
Mortgage Type
Commercial
Create a Home Valuation Report for This Property
The Home Valuation Report is an in-depth analysis detailing your home's value as well as a comparison with similar homes in the area
Home Values in the Area
Average Home Value in this Area
Purchase History
| Date | Buyer | Sale Price | Title Company |
|---|---|---|---|
| Constanza Francisco | -- | None Available | |
| Constanza Francisco | $238,000 | Towns Title & Co Inc | |
| Lazano Romulo | $136,000 | -- | |
| Smith Dale N | $73,500 | -- |
Source: Public Records
Mortgage History
| Date | Status | Borrower | Loan Amount |
|---|---|---|---|
| Open | Constanza Francisco | $190,400 | |
| Previous Owner | Smith Dale N | $50,000 |
Source: Public Records
Tax History Compared to Growth
Tax History
| Year | Tax Paid | Tax Assessment Tax Assessment Total Assessment is a certain percentage of the fair market value that is determined by local assessors to be the total taxable value of land and additions on the property. | Land | Improvement |
|---|---|---|---|---|
| 2025 | $1,911 | $69,554 | -- | -- |
| 2024 | $1,770 | $67,594 | -- | -- |
| 2023 | $1,770 | $65,625 | $0 | $0 |
| 2022 | $1,548 | $63,309 | $0 | $0 |
| 2021 | $1,430 | $148,717 | $20,000 | $128,717 |
| 2020 | $1,404 | $60,616 | $0 | $0 |
| 2019 | $1,358 | $59,253 | $0 | $0 |
| 2018 | $1,338 | $58,148 | $0 | $0 |
| 2017 | $1,299 | $56,952 | $0 | $0 |
| 2016 | $1,239 | $103,404 | $16,000 | $87,404 |
| 2015 | $1,187 | $89,601 | $12,500 | $77,101 |
| 2014 | -- | $80,995 | $12,500 | $68,495 |
| 2013 | -- | $65,989 | $8,500 | $57,489 |
Source: Public Records
Map
Nearby Homes
- 1031 SE 8th Terrace Unit 2H
- 1104 SE 8th St Unit 5
- 916 SE 8th Terrace
- 717 SE 10th Ave
- 711 SE 11th Ave
- 711 SE 12th Ave Unit 136
- 711 SE 12th Ave Unit 134
- 711 SE 12th Ave Unit 135
- 719 SE 12th Ave Unit 106
- 707 SE 9th Place
- 629 SE 10th Place
- 1223 SE 8th St Unit 48
- 623 SE 12th Ave Unit 123
- 623 SE 12th Ave Unit 121
- 616 SE 11th Ave
- 628 SE 9th Place
- 646 SE 12th Ct Unit 18
- 602 SE 9th St
- 708 SE 9th St
- 706,712,718 SE 7th St
- 1013 SE 9th St
- 1018 SE 8th Terrace
- 1018 SE 8th Terrace Unit 7
- 1011/1013 SE 8th Terrace
- 1021 SE 8th Terrace Unit 4F
- 1021 SE 8th Terrace Unit 4H
- 1021 SE 8th Terrace Unit B
- 1021 SE 8th Terrace Unit H
- 1021 SE 8th Terrace Unit F
- 1021 SE 8th Terrace Unit C
- 1021 SE 8th Terrace Unit G
- 1021 SE 8th Terrace Unit D
- 1021 SE 8th Terrace Unit E
- 1021 SE 8th Terrace Unit 4G
- 1021 SE 8th Terrace Unit 4E
- 1004 SE 8th St
- 1004 SE 8th St
- 1004 SE 8th St Unit 105
- 1004 SE 8th St Unit 104
- 1004 SE 8th St Unit 202