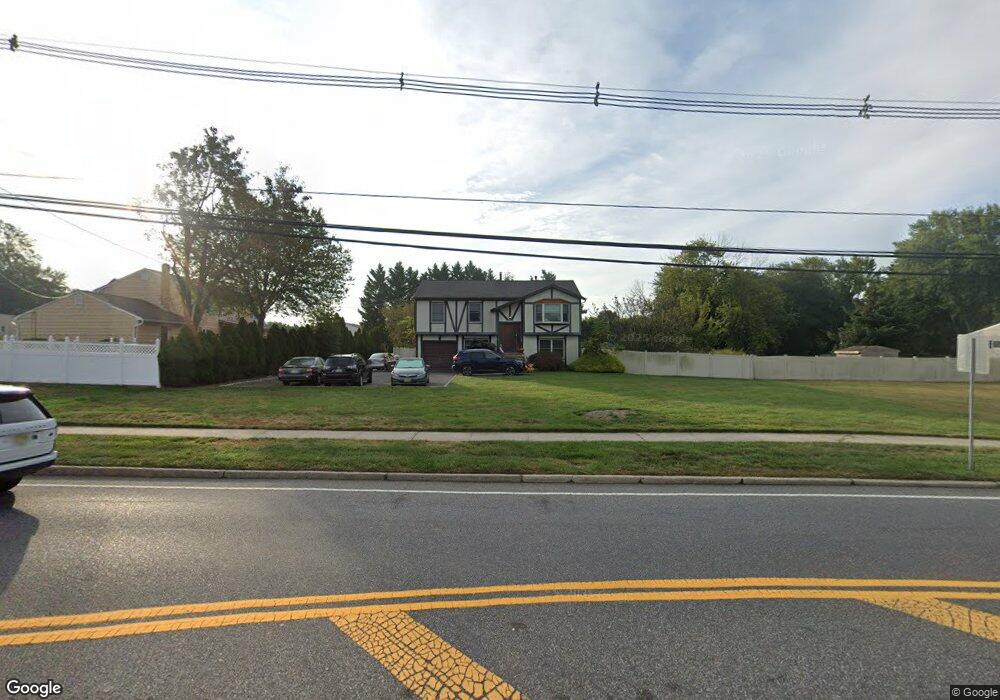
1010 Sycamore Ave Tinton Falls, NJ 07724
Estimated Value: $802,019 - $893,000
4
Beds
3
Baths
1,924
Sq Ft
$435/Sq Ft
Est. Value
About This Home
This home is located at 1010 Sycamore Ave, Tinton Falls, NJ 07724 and is currently estimated at $837,255, approximately $435 per square foot. 1010 Sycamore Ave is a home located in Monmouth County with nearby schools including Mahala F. Atchinson Elementary School, Swimming River Elementary School, and Tinton Falls Middle School.
Ownership History
Date
Name
Owned For
Owner Type
Purchase Details
Closed on
Jul 2, 2001
Sold by
Marelli Michael
Bought by
Nygren Donald
Current Estimated Value
Home Financials for this Owner
Home Financials are based on the most recent Mortgage that was taken out on this home.
Original Mortgage
$207,000
Interest Rate
7.16%
Create a Home Valuation Report for This Property
The Home Valuation Report is an in-depth analysis detailing your home's value as well as a comparison with similar homes in the area
Home Values in the Area
Average Home Value in this Area
Purchase History
| Date | Buyer | Sale Price | Title Company |
|---|---|---|---|
| Nygren Donald | $230,000 | -- |
Source: Public Records
Mortgage History
| Date | Status | Borrower | Loan Amount |
|---|---|---|---|
| Previous Owner | Nygren Donald | $207,000 |
Source: Public Records
Tax History Compared to Growth
Tax History
| Year | Tax Paid | Tax Assessment Tax Assessment Total Assessment is a certain percentage of the fair market value that is determined by local assessors to be the total taxable value of land and additions on the property. | Land | Improvement |
|---|---|---|---|---|
| 2025 | $9,163 | $634,400 | $279,600 | $354,800 |
| 2024 | $8,945 | $630,200 | $303,900 | $326,300 |
| 2023 | $8,945 | $581,600 | $264,800 | $316,800 |
| 2022 | $8,548 | $515,800 | $214,100 | $301,700 |
| 2021 | $7,982 | $441,300 | $202,700 | $238,600 |
| 2020 | $8,403 | $419,100 | $185,900 | $233,200 |
| 2019 | $7,982 | $399,100 | $180,200 | $218,900 |
| 2018 | $8,080 | $403,200 | $194,500 | $208,700 |
| 2017 | $8,234 | $400,900 | $198,500 | $202,400 |
| 2016 | $8,518 | $406,000 | $208,700 | $197,300 |
| 2015 | $8,900 | $429,100 | $236,900 | $192,200 |
| 2014 | $7,842 | $360,700 | $154,000 | $206,700 |
Source: Public Records
Map
Nearby Homes
- 31 Branford Cir
- 834 Sycamore Ave
- 56 Mulberry Ln
- 19 Helene Ct Unit 19
- 26 Mariveles Way
- 68 Oak Ln
- 26 Rambling Meadow Ct
- 43 Midway Rd N
- 29 Oak Ln
- 103 Barker Ave
- 66 Barker Ave
- 40 Barker Ave
- 19 Belshaw Ave
- 8 Ann Ct
- 416 Crawford St
- 34 Barker Ave
- 28 Belshaw Ave
- 20 Barker Ave
- 3 Jockey Terrace N
- 712 Sycamore Ave