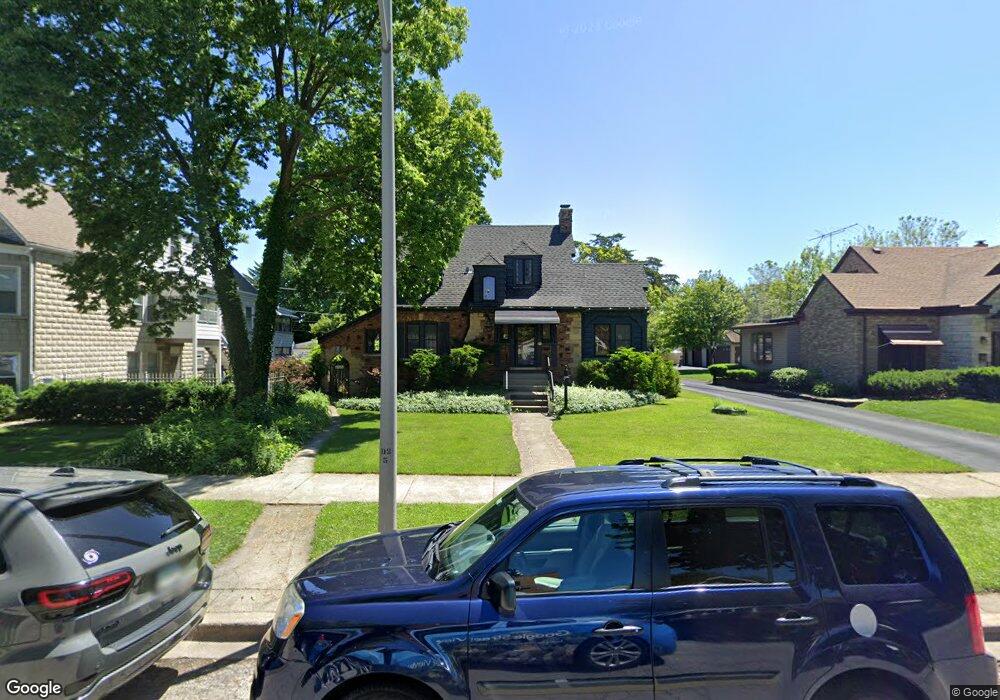
1010 Troost Ave Forest Park, IL 60130
Estimated Value: $420,580 - $477,000
4
Beds
2
Baths
1,355
Sq Ft
$325/Sq Ft
Est. Value
About This Home
This home is located at 1010 Troost Ave, Forest Park, IL 60130 and is currently estimated at $440,145, approximately $324 per square foot. 1010 Troost Ave is a home located in Cook County with nearby schools including Garfield Elementary School, Field Stevenson Elementary School, and Betsy Ross Elementary School.
Ownership History
Date
Name
Owned For
Owner Type
Purchase Details
Closed on
Aug 12, 2005
Sold by
Daly Sharon M
Bought by
Anderson Thomas J and Anderson Linda M
Current Estimated Value
Home Financials for this Owner
Home Financials are based on the most recent Mortgage that was taken out on this home.
Original Mortgage
$319,200
Outstanding Balance
$170,151
Interest Rate
5.89%
Mortgage Type
Fannie Mae Freddie Mac
Estimated Equity
$269,994
Purchase Details
Closed on
Nov 19, 2002
Sold by
Long William T
Bought by
Daly Sharon and Long William T
Purchase Details
Closed on
Aug 13, 2001
Sold by
Bennett John L and Bennett Cheryl M
Bought by
Long William T
Home Financials for this Owner
Home Financials are based on the most recent Mortgage that was taken out on this home.
Original Mortgage
$216,000
Interest Rate
7.23%
Purchase Details
Closed on
Oct 23, 1998
Sold by
Bennett John L and Bennett Cheryl M
Bought by
Bennett John L and Bennett Cheryl M
Create a Home Valuation Report for This Property
The Home Valuation Report is an in-depth analysis detailing your home's value as well as a comparison with similar homes in the area
Home Values in the Area
Average Home Value in this Area
Purchase History
| Date | Buyer | Sale Price | Title Company |
|---|---|---|---|
| Anderson Thomas J | $400,000 | Commonwealth Title | |
| Daly Sharon | -- | -- | |
| Long William T | $270,000 | -- | |
| Bennett John L | -- | -- |
Source: Public Records
Mortgage History
| Date | Status | Borrower | Loan Amount |
|---|---|---|---|
| Open | Anderson Thomas J | $319,200 | |
| Previous Owner | Long William T | $216,000 |
Source: Public Records
Tax History Compared to Growth
Tax History
| Year | Tax Paid | Tax Assessment Tax Assessment Total Assessment is a certain percentage of the fair market value that is determined by local assessors to be the total taxable value of land and additions on the property. | Land | Improvement |
|---|---|---|---|---|
| 2024 | $7,588 | $31,233 | $7,384 | $23,849 |
| 2023 | $8,069 | $31,233 | $7,384 | $23,849 |
| 2022 | $8,069 | $28,669 | $5,661 | $23,008 |
| 2021 | $7,719 | $28,668 | $5,660 | $23,008 |
| 2020 | $9,068 | $32,919 | $5,660 | $27,259 |
| 2019 | $7,626 | $27,830 | $5,168 | $22,662 |
| 2018 | $8,413 | $27,830 | $5,168 | $22,662 |
| 2017 | $8,248 | $27,830 | $5,168 | $22,662 |
| 2016 | $7,756 | $24,140 | $4,676 | $19,464 |
| 2015 | $7,590 | $24,140 | $4,676 | $19,464 |
| 2014 | $7,466 | $24,140 | $4,676 | $19,464 |
| 2013 | $8,316 | $28,342 | $4,676 | $23,666 |
Source: Public Records
Map
Nearby Homes
- 940 Troost Ave
- 7742 Taylor St
- 1008 Lathrop Ave
- 900 Dunlop Ave
- 1013 Ferdinand Ave
- 1007 Ferdinand Ave
- 900 Lathrop Ave
- 1024 Ferdinand Ave
- 1124 Lathrop Ave
- 915 Ferdinand Ave
- 1115 Ferdinand Ave
- 946 Ferdinand Ave
- 944 Beloit Ave Unit 4
- 944 Beloit Ave Unit 5
- 944 Beloit Ave Unit 1
- 944 Beloit Ave Unit 2
- 1118 Thomas Ave
- 827 Thomas Ave
- 1103 Circle Ave
- 1042 Circle Ave
- 1020 Troost Ave
- 1022 Troost Ave
- 7712 Harvard St
- 7710 Harvard St
- 7714 Harvard St
- 1026 Troost Ave Unit 1
- 7708 Harvard St
- 7716 Harvard St
- 7706 Harvard St
- 7706 Harvard St Unit 7706
- 7718 Harvard St
- 7704 Harvard St
- 1028 Troost Ave
- 1013 Dunlop Ave
- 1015 Dunlop Ave
- 1017 Dunlop Ave
- 1011 Dunlop Ave
- 1009 Dunlop Ave
- 1019 Dunlop Ave
- 7647 Taylor St