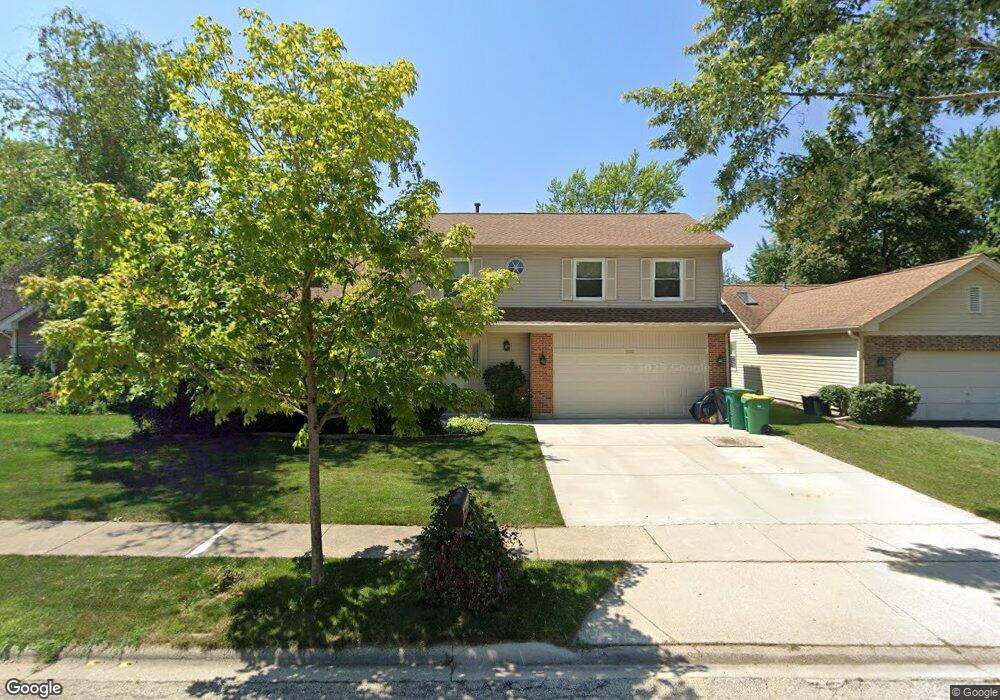
1010 Weeping Willow Dr Unit 2 Wheeling, IL 60090
Estimated Value: $492,859 - $585,000
3
Beds
3
Baths
2,176
Sq Ft
$245/Sq Ft
Est. Value
About This Home
This home is located at 1010 Weeping Willow Dr Unit 2, Wheeling, IL 60090 and is currently estimated at $532,465, approximately $244 per square foot. 1010 Weeping Willow Dr Unit 2 is a home located in Cook County with nearby schools including Dwight D Eisenhower Elementary School, Anne Sullivan Elementary School, and Betsy Ross Elementary School.
Ownership History
Date
Name
Owned For
Owner Type
Purchase Details
Closed on
Nov 20, 2003
Sold by
Ven Sarith and Nem Savon
Bought by
Nop Saravuth and Nop Gina S
Current Estimated Value
Home Financials for this Owner
Home Financials are based on the most recent Mortgage that was taken out on this home.
Original Mortgage
$270,000
Outstanding Balance
$123,040
Interest Rate
6.1%
Mortgage Type
Unknown
Estimated Equity
$409,425
Purchase Details
Closed on
Oct 22, 1993
Sold by
Kengott Clare Ann and Kengott Robert J
Bought by
Ven Sarith and Nem Savon
Home Financials for this Owner
Home Financials are based on the most recent Mortgage that was taken out on this home.
Original Mortgage
$155,000
Interest Rate
7%
Create a Home Valuation Report for This Property
The Home Valuation Report is an in-depth analysis detailing your home's value as well as a comparison with similar homes in the area
Home Values in the Area
Average Home Value in this Area
Purchase History
| Date | Buyer | Sale Price | Title Company |
|---|---|---|---|
| Nop Saravuth | $350,000 | Rtc | |
| Ven Sarith | $153,000 | -- |
Source: Public Records
Mortgage History
| Date | Status | Borrower | Loan Amount |
|---|---|---|---|
| Open | Nop Saravuth | $270,000 | |
| Previous Owner | Ven Sarith | $155,000 |
Source: Public Records
Tax History
| Year | Tax Paid | Tax Assessment Tax Assessment Total Assessment is a certain percentage of the fair market value that is determined by local assessors to be the total taxable value of land and additions on the property. | Land | Improvement |
|---|---|---|---|---|
| 2025 | $9,204 | $46,001 | $8,873 | $37,128 |
| 2024 | $9,204 | $34,274 | $7,508 | $26,766 |
| 2023 | $8,762 | $34,274 | $7,508 | $26,766 |
| 2022 | $8,762 | $34,274 | $7,508 | $26,766 |
| 2021 | $8,409 | $28,723 | $5,118 | $23,605 |
| 2020 | $8,255 | $28,723 | $5,118 | $23,605 |
| 2019 | $8,295 | $32,057 | $5,118 | $26,939 |
| 2018 | $8,194 | $29,177 | $4,436 | $24,741 |
| 2017 | $8,095 | $29,177 | $4,436 | $24,741 |
| 2016 | $7,785 | $29,177 | $4,436 | $24,741 |
| 2015 | $7,691 | $26,924 | $3,924 | $23,000 |
| 2014 | $7,510 | $26,924 | $3,924 | $23,000 |
| 2013 | $7,270 | $26,924 | $3,924 | $23,000 |
Source: Public Records
Map
Nearby Homes
- 1111 Pleasant Run Dr Unit 911
- 1125 Pleasant Run Dr Unit 807
- 1201 Pleasant Run Dr Unit 312
- 751 Garth Rd
- 448 Bridle Trail Unit 211
- 523 Bridle Trail Unit 161
- 1376 Longacre Ln Unit 113
- 200 Violet Ln
- 1430 Sandstone Dr Unit 202
- 1450 Sandpebble Dr Unit 333
- 1525 Sander Ct Unit 113
- 1033 Wheeling Rd
- 475 E Merle Ln
- 492 Bernice Ct
- 802 Andover Ct
- 353 E Norman Ln
- 307 Anne Ct
- 231 E Wayne Place
- 665 Cindy Ln
- 2812 Jackson Dr
- 1000 Weeping Willow Dr
- 1020 Weeping Willow Dr
- 1030 Weeping Willow Dr Unit 2
- 1019 Drake Ave
- 990 Weeping Willow Dr
- 1001 Weeping Willow Dr
- 1017 Weeping Willow Dr
- 997 Weeping Willow Dr
- 1017 Drake Ave
- 1040 Weeping Willow Dr
- 1027 Weeping Willow Dr
- 980 Weeping Willow Dr
- 987 Weeping Willow Dr
- 996 Honeysuckle Dr
- 1047 Weeping Willow Dr
- 1050 Weeping Willow Dr
- 970 Tanglewood Dr
- 977 Weeping Willow Dr
- 1006 Honeysuckle Dr
- 986 Honeysuckle Dr