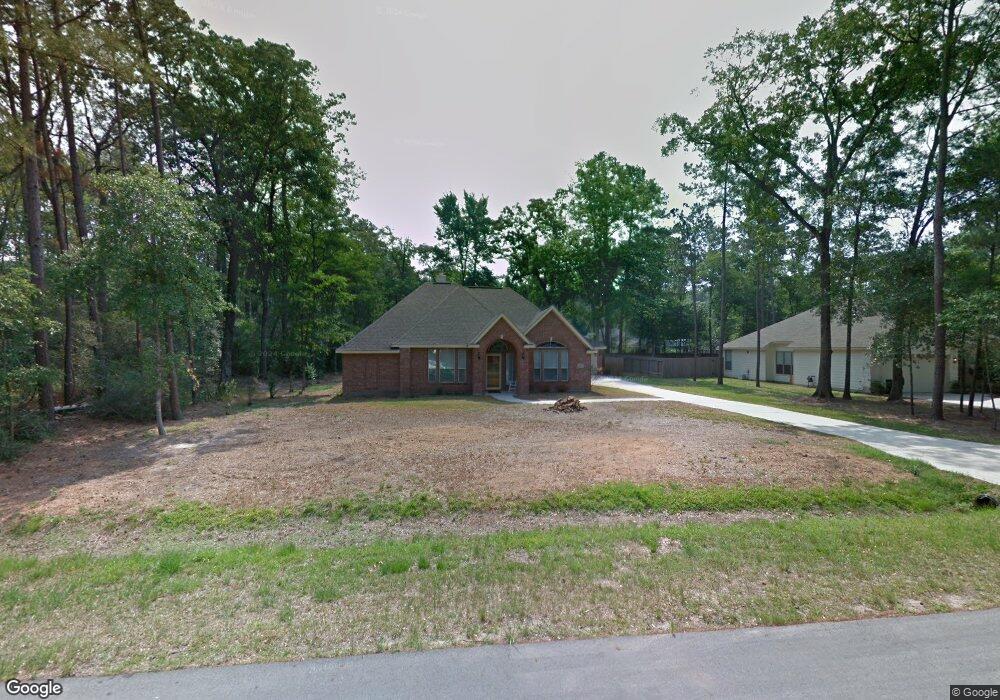
1010 Weisinger Dr Magnolia, TX 77354
Westwood NeighborhoodEstimated Value: $401,000 - $456,000
3
Beds
2
Baths
2,038
Sq Ft
$211/Sq Ft
Est. Value
About This Home
This home is located at 1010 Weisinger Dr, Magnolia, TX 77354 and is currently estimated at $429,135, approximately $210 per square foot. 1010 Weisinger Dr is a home located in Montgomery County with nearby schools including Tom R. Ellisor Elementary School, Bear Branch Junior High School, and Magnolia High School.
Ownership History
Date
Name
Owned For
Owner Type
Purchase Details
Closed on
Feb 16, 2011
Sold by
Deutsche Bank National Trust Co
Bought by
Jatzlau Edwin
Current Estimated Value
Home Financials for this Owner
Home Financials are based on the most recent Mortgage that was taken out on this home.
Original Mortgage
$147,440
Outstanding Balance
$102,221
Interest Rate
5.06%
Mortgage Type
New Conventional
Estimated Equity
$326,914
Purchase Details
Closed on
Jan 4, 2011
Sold by
Linney Fred E and Linney Delores M
Bought by
Jatzlau Edwin
Home Financials for this Owner
Home Financials are based on the most recent Mortgage that was taken out on this home.
Original Mortgage
$147,440
Outstanding Balance
$102,221
Interest Rate
5.06%
Mortgage Type
New Conventional
Estimated Equity
$326,914
Purchase Details
Closed on
Jan 21, 2005
Sold by
Prebisch Homes Inc
Bought by
Jatzlau Edwin
Create a Home Valuation Report for This Property
The Home Valuation Report is an in-depth analysis detailing your home's value as well as a comparison with similar homes in the area
Home Values in the Area
Average Home Value in this Area
Purchase History
| Date | Buyer | Sale Price | Title Company |
|---|---|---|---|
| Jatzlau Edwin | -- | None Available | |
| Jatzlau Edwin | -- | -- | |
| Jatzlau Edwin | -- | -- |
Source: Public Records
Mortgage History
| Date | Status | Borrower | Loan Amount |
|---|---|---|---|
| Open | Jatzlau Edwin | $147,440 |
Source: Public Records
Tax History Compared to Growth
Tax History
| Year | Tax Paid | Tax Assessment Tax Assessment Total Assessment is a certain percentage of the fair market value that is determined by local assessors to be the total taxable value of land and additions on the property. | Land | Improvement |
|---|---|---|---|---|
| 2025 | $4,442 | $393,023 | $80,000 | $313,023 |
| 2024 | $3,938 | $362,791 | -- | -- |
| 2023 | $3,938 | $329,810 | $80,000 | $295,430 |
| 2022 | $5,291 | $299,830 | $82,650 | $286,530 |
| 2021 | $5,066 | $272,570 | $57,000 | $215,570 |
| 2020 | $5,264 | $260,130 | $57,000 | $203,130 |
| 2019 | $5,189 | $257,670 | $57,000 | $200,670 |
| 2018 | $4,362 | $234,610 | $20,000 | $214,610 |
| 2017 | $4,975 | $234,610 | $20,000 | $214,610 |
| 2016 | $4,859 | $229,160 | $20,000 | $209,160 |
| 2015 | $4,060 | $219,200 | $20,000 | $203,480 |
| 2014 | $4,060 | $199,270 | $20,000 | $179,270 |
Source: Public Records
Map
Nearby Homes
- 906 Weeping Willow Way
- 6422 Sugar Bush Dr
- 906 Wiley Dr
- 6221 Ranch Lake Dr
- 803 Box Elder Dr
- 1411 Honea Egypt Rd
- 6107 Cypress Way Dr
- 6706 Durango Creek Dr
- 1518 Honea Egypt Rd
- 6718 Durango Creek Dr
- 6626 Grant Dr
- 914 Box Elder Dr
- 5918 Mahogany Way
- 723 Hinsdale
- 6846 Durango Creek Dr
- 502 Garrett Dr
- 506 Weeping Willow Way
- 503 Weisinger Dr
- 1817 Ranch Trail Ct
- 6910 Woodland Oaks
- 1002 Weisinger Dr
- 1014 Weisinger Dr
- 0 Weisinger Unit 8275498
- 0 Weisinger Unit 8610867
- 0 Weisinger Unit 7092796
- 0 Weisinger Unit 14395442
- 0 Weisinger Unit 27564144
- 0 Weisinger Unit 21165833
- 1007 Weeping Willow Way
- 926 Weisinger Dr
- 1003 Weeping Willow Way
- 1011 Weisinger Dr
- 1011 Weisinger Dr
- 923 Weeping Willow Way
- 1015 Weeping Willow Way
- 1015 Weisinger
- 1022 Weisinger Dr
- 922 Weisinger Dr
- Lot 29 Weisinger Dr
- 919 Weeping Willow Way