Estimated Value: $321,000 - $388,000
4
Beds
3
Baths
2,907
Sq Ft
$123/Sq Ft
Est. Value
About This Home
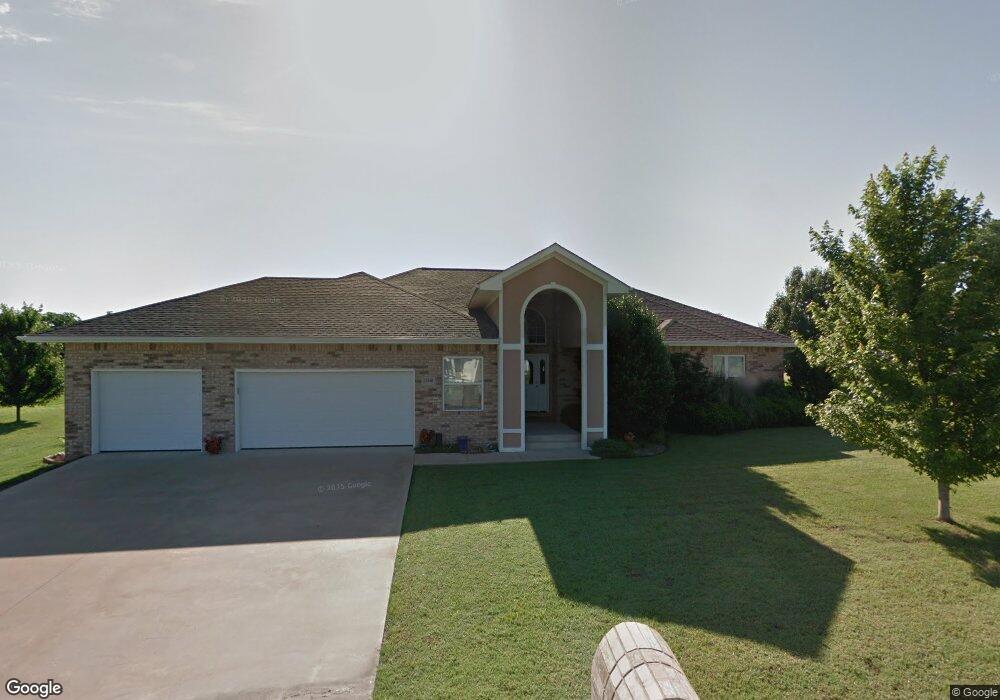
This home is located at 10100 S 593 Rd, Miami, OK 74354 and is currently estimated at $357,278, approximately $122 per square foot. 10100 S 593 Rd is a home located in Ottawa County with nearby schools including Miami High School.
Ownership History
Date
Name
Owned For
Owner Type
Purchase Details
Closed on
Feb 19, 2021
Sold by
Mulford Bruce and Mulford Kim
Bought by
Reese James L and Resse Lori Ann
Current Estimated Value
Home Financials for this Owner
Home Financials are based on the most recent Mortgage that was taken out on this home.
Original Mortgage
$219,800
Outstanding Balance
$160,677
Interest Rate
2.7%
Mortgage Type
New Conventional
Estimated Equity
$196,601
Purchase Details
Closed on
Nov 12, 2020
Sold by
Howard Randall L and The Randall L Howad Revocable
Bought by
Mulford Bruce and Mulford Kim
Purchase Details
Closed on
Oct 26, 2011
Sold by
Howard Randall L
Bought by
Howard Randall L and Randall L Howard Revocable Trust
Purchase Details
Closed on
Jun 20, 2005
Sold by
Howard Willie U and Howard Willie
Bought by
Howard Willie U and Howard Randall L
Purchase Details
Closed on
Mar 30, 2005
Sold by
Hughes Stanley E and Hughes Shelley R
Bought by
Howard Randall L and Howard Jackie C
Create a Home Valuation Report for This Property
The Home Valuation Report is an in-depth analysis detailing your home's value as well as a comparison with similar homes in the area
Home Values in the Area
Average Home Value in this Area
Purchase History
| Date | Buyer | Sale Price | Title Company |
|---|---|---|---|
| Reese James L | $275,000 | Oklahoma City Abstract & Ttl | |
| Mulford Bruce | $260,000 | Apex Title Northeast Ok Llc | |
| Howard Randall L | -- | None Available | |
| Howard Willie U | -- | None Available | |
| Howard Randall L | $15,000 | None Available |
Source: Public Records
Mortgage History
| Date | Status | Borrower | Loan Amount |
|---|---|---|---|
| Open | Reese James L | $219,800 |
Source: Public Records
Tax History Compared to Growth
Tax History
| Year | Tax Paid | Tax Assessment Tax Assessment Total Assessment is a certain percentage of the fair market value that is determined by local assessors to be the total taxable value of land and additions on the property. | Land | Improvement |
|---|---|---|---|---|
| 2025 | $3,020 | $31,352 | $1,710 | $29,642 |
| 2024 | $3,020 | $31,327 | $1,710 | $29,617 |
| 2023 | $3,020 | $31,327 | $1,710 | $29,617 |
| 2022 | $2,896 | $31,327 | $1,710 | $29,617 |
| 2021 | $2,801 | $29,640 | $1,710 | $27,930 |
| 2020 | $2,189 | $23,969 | $1,692 | $22,277 |
| 2019 | $1,829 | $23,272 | $1,643 | $21,629 |
| 2018 | $1,785 | $22,594 | $1,595 | $20,999 |
| 2017 | $1,759 | $21,936 | $1,548 | $20,388 |
| 2016 | $1,631 | $21,296 | $1,502 | $19,794 |
| 2015 | $1,636 | $19,490 | $1,710 | $17,780 |
| 2014 | $1,612 | $20,677 | $1,459 | $19,218 |
Source: Public Records
Map
Nearby Homes
- 59501 E 100 Rd
- 9985 S 593 Rd
- 10526 S 590 Rd
- 0 S 600 Rd Unit 24321477
- 58920 E 102 Rd
- 59608 W Peoria Cir
- 0 E 110 Rd Unit 25-2147
- 60250 E 90 Rd
- 11631 S 587 Rd
- 10301 S 600 Rd
- 11703 S 587 Rd
- 11801 S 600 Rd
- 9021 S 614 Rd Unit Lot 4
- 9851 S 614 Rd
- 1216 Johnson Dr
- 17 S Elm St
- 2014 Harvard Ave
- 1831 7th Ave NE
- 2003 E Rockdale Rd
- 610 Mckinley Blvd