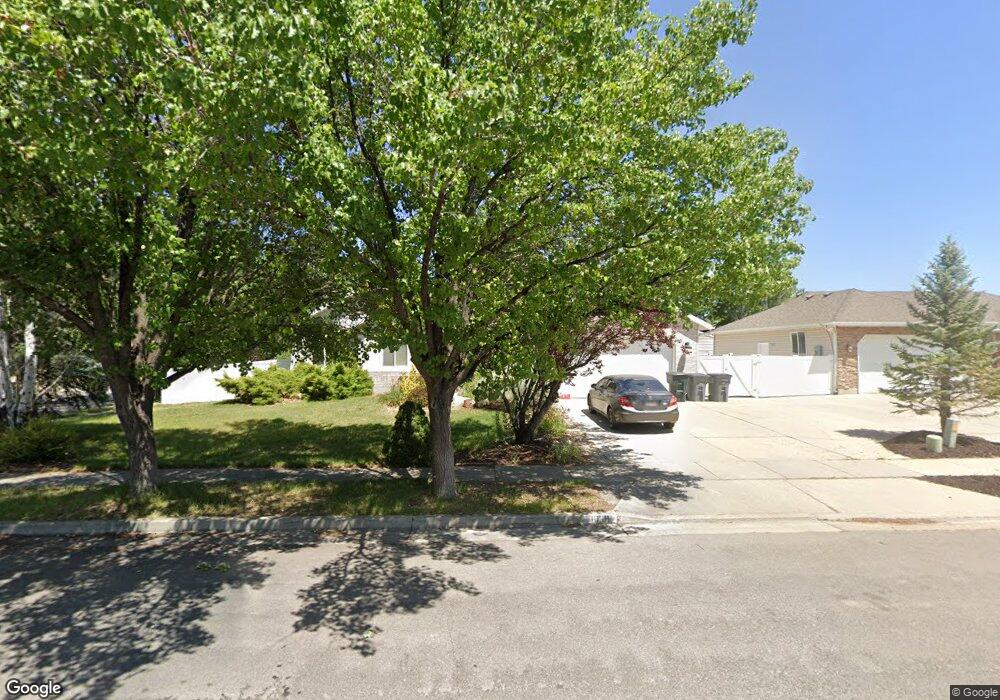
10101 Barnsley Ln South Jordan, UT 84095
Glenmoor Country Estates NeighborhoodEstimated Value: $668,000 - $703,000
6
Beds
4
Baths
3,142
Sq Ft
$218/Sq Ft
Est. Value
About This Home
This home is located at 10101 Barnsley Ln, South Jordan, UT 84095 and is currently estimated at $684,719, approximately $217 per square foot. 10101 Barnsley Ln is a home located in Salt Lake County with nearby schools including Welby Elementary School, Elk Ridge Middle School, and American Academy of Innovation.
Ownership History
Date
Name
Owned For
Owner Type
Purchase Details
Closed on
Mar 25, 2015
Sold by
Hansen Barr
Bought by
Giessing Michael L and Giessing Rachel
Current Estimated Value
Home Financials for this Owner
Home Financials are based on the most recent Mortgage that was taken out on this home.
Original Mortgage
$301,150
Outstanding Balance
$230,395
Interest Rate
3.65%
Mortgage Type
New Conventional
Estimated Equity
$454,324
Purchase Details
Closed on
Jan 22, 2007
Sold by
Pulsipher Matthew and Pulsipher Rachel
Bought by
Hansen Barry
Home Financials for this Owner
Home Financials are based on the most recent Mortgage that was taken out on this home.
Original Mortgage
$335,000
Interest Rate
6.1%
Mortgage Type
Purchase Money Mortgage
Purchase Details
Closed on
Jan 5, 2006
Sold by
Pulsipher Matthew
Bought by
Pulsipher Matthew and Pulsipher Rachel
Home Financials for this Owner
Home Financials are based on the most recent Mortgage that was taken out on this home.
Original Mortgage
$35,000
Interest Rate
6.25%
Mortgage Type
Credit Line Revolving
Purchase Details
Closed on
Feb 10, 2004
Sold by
Pulsipher Matt
Bought by
Pulsipher Matt and Pulsipher Rachel
Home Financials for this Owner
Home Financials are based on the most recent Mortgage that was taken out on this home.
Original Mortgage
$220,041
Interest Rate
5.82%
Mortgage Type
FHA
Purchase Details
Closed on
Feb 3, 2004
Sold by
Cooper R Samuel and Cooper Melanie M
Bought by
Pulsipher Matt
Home Financials for this Owner
Home Financials are based on the most recent Mortgage that was taken out on this home.
Original Mortgage
$220,041
Interest Rate
5.82%
Mortgage Type
FHA
Purchase Details
Closed on
Oct 25, 2002
Sold by
Cendant Mobility Financial Corp
Bought by
Cooper R Samuel and Cooper Melanie M
Home Financials for this Owner
Home Financials are based on the most recent Mortgage that was taken out on this home.
Original Mortgage
$208,900
Interest Rate
5.31%
Purchase Details
Closed on
Sep 18, 2002
Sold by
Cuevas Jose R
Bought by
Cendant Mobility Financial Corp
Home Financials for this Owner
Home Financials are based on the most recent Mortgage that was taken out on this home.
Original Mortgage
$208,900
Interest Rate
5.31%
Purchase Details
Closed on
Jun 9, 2000
Sold by
Cuevas Jose R
Bought by
Cuevas Jose R
Purchase Details
Closed on
Apr 12, 2000
Sold by
Majestic Homes Inc
Bought by
Majestic Homes Inc and Cuevas Jose R
Create a Home Valuation Report for This Property
The Home Valuation Report is an in-depth analysis detailing your home's value as well as a comparison with similar homes in the area
Home Values in the Area
Average Home Value in this Area
Purchase History
| Date | Buyer | Sale Price | Title Company |
|---|---|---|---|
| Giessing Michael L | -- | Meridian Title | |
| Hansen Barry | -- | Surety Title | |
| Pulsipher Matthew | -- | Title West | |
| Pulsipher Matthew | -- | Title West | |
| Pulsipher Matt | -- | Premier Title Ins Agency | |
| Pulsipher Matt | -- | Premier Title Ins Agency | |
| Cooper R Samuel | -- | Equity Title | |
| Cendant Mobility Financial Corp | -- | Equity Title | |
| Cuevas Jose R | -- | Merrill Title | |
| Cuevas Jose R | -- | Merrill Title | |
| Majestic Homes Inc | -- | Merrill Title |
Source: Public Records
Mortgage History
| Date | Status | Borrower | Loan Amount |
|---|---|---|---|
| Open | Giessing Michael L | $301,150 | |
| Previous Owner | Hansen Barry | $335,000 | |
| Previous Owner | Pulsipher Matthew | $35,000 | |
| Previous Owner | Pulsipher Matt | $220,041 | |
| Previous Owner | Cooper R Samuel | $208,900 |
Source: Public Records
Tax History Compared to Growth
Tax History
| Year | Tax Paid | Tax Assessment Tax Assessment Total Assessment is a certain percentage of the fair market value that is determined by local assessors to be the total taxable value of land and additions on the property. | Land | Improvement |
|---|---|---|---|---|
| 2025 | $3,186 | $657,000 | $188,600 | $468,400 |
| 2024 | $3,186 | $605,000 | $175,000 | $430,000 |
| 2023 | $3,250 | $582,300 | $170,000 | $412,300 |
| 2022 | $3,384 | $594,200 | $166,700 | $427,500 |
| 2021 | $2,784 | $448,500 | $127,300 | $321,200 |
| 2020 | $2,703 | $408,200 | $123,200 | $285,000 |
| 2019 | $2,668 | $396,000 | $123,200 | $272,800 |
| 2018 | $2,480 | $366,300 | $123,200 | $243,100 |
| 2017 | $2,394 | $346,500 | $100,800 | $245,700 |
| 2016 | $2,420 | $331,900 | $100,800 | $231,100 |
| 2015 | $2,418 | $322,500 | $102,700 | $219,800 |
| 2014 | $2,255 | $295,600 | $95,000 | $200,600 |
Source: Public Records
Map
Nearby Homes
- 10027 Birdie Way
- 10117 S Glenmoor Dr
- 4554 Birdie Way
- 4722 W Vermillion Dr
- 4722 W Noyo Ln
- 4712 W South Jordan Pkwy
- 4523 W South Jordan Pkwy
- 4801 W South Jordan Pkwy
- 4438 W South Jordan Pkwy
- 4208 W Chestnut View Dr
- 4881 S Jordan Pkwy W
- 10426 S Millerton Dr
- 10566 S Oquirrh Lake Rd
- 4424 W Skye Dr
- 4821 W Dock St
- 4271 W Clarks Hill Dr
- 10566 S Lake Ave
- 4518 W Cave Run Ln
- 4058 W Ascot Downs Dr
- 5023 S Jordan Pkwy W
- 10101 S Barnsley Ln
- 10113 Barnsley Ln
- 10102 Tranmere Ave
- 10102 S Tranmere Ave
- 10114 Tranmere Ave
- 4596 Knox Dr
- 4608 Knox Dr
- 4608 W Knox Dr
- 10127 Barnsley Ln
- 4582 Knox Dr
- 10124 Tranmere Ave
- 4622 Knox Dr
- 10124 S Tranmere Ave
- 10096 Barnsley Ln
- 10096 S Barnsley Ln
- 10118 Barnsley Ln
- 10137 Barnsley Ln
- 4568 Knox Dr
- 10132 Barnsley Ln
- 10132 S Barnsley Ln