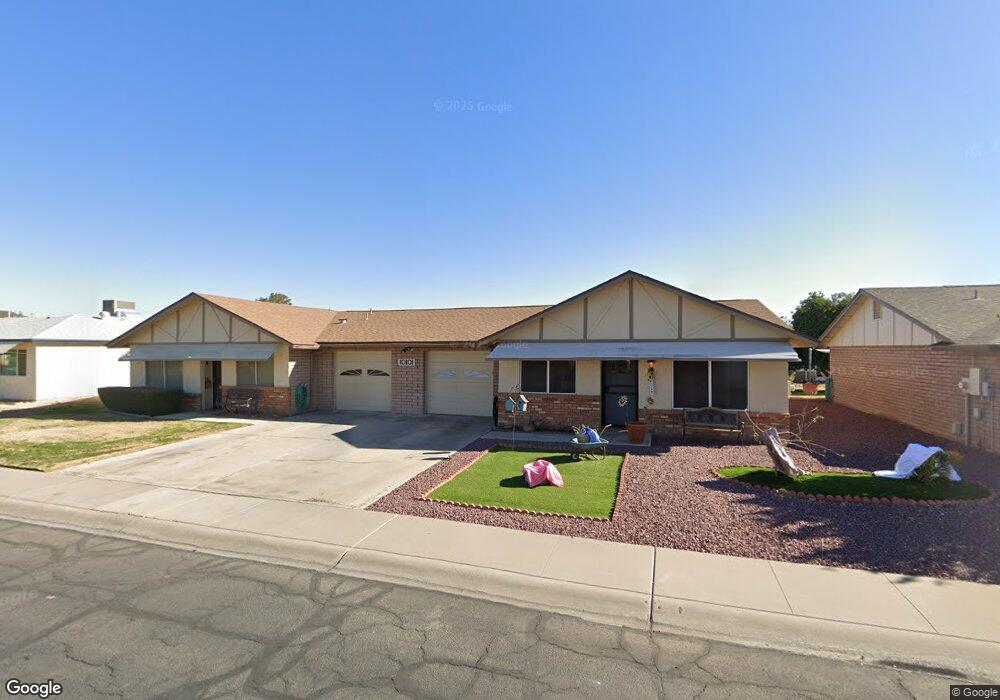
10101 N 97th Dr Unit B Peoria, AZ 85345
Estimated Value: $196,000 - $229,000
--
Bed
2
Baths
1,157
Sq Ft
$184/Sq Ft
Est. Value
About This Home
This home is located at 10101 N 97th Dr Unit B, Peoria, AZ 85345 and is currently estimated at $212,978, approximately $184 per square foot. 10101 N 97th Dr Unit B is a home located in Maricopa County with nearby schools including Sun Valley Elementary School, Raymond S. Kellis, and Ombudsman - Northwest Charter.
Ownership History
Date
Name
Owned For
Owner Type
Purchase Details
Closed on
Aug 12, 2025
Sold by
Boop Clayton M
Bought by
10125 N 97Th Dr Llc
Current Estimated Value
Purchase Details
Closed on
May 21, 2021
Sold by
Fink Lee Roy and Fink Susan E
Bought by
Boop Clayton M
Home Financials for this Owner
Home Financials are based on the most recent Mortgage that was taken out on this home.
Original Mortgage
$108,000
Interest Rate
3%
Mortgage Type
New Conventional
Purchase Details
Closed on
Mar 27, 2020
Sold by
Fink Lee Roy and Fink Susan E
Bought by
Fink Lee Roy and Fink Susan E
Purchase Details
Closed on
Jul 2, 2014
Sold by
Fink Lee Roy
Bought by
Fink Lee Roy and Fink Susan E
Purchase Details
Closed on
Aug 20, 1996
Sold by
Forman Julia J Tabor
Bought by
Forman Julia J Tabor and The Julia J Tabor Forman Trust
Purchase Details
Closed on
Sep 21, 1994
Sold by
Bouchie Claude F and Bouchie Katherine
Bought by
Forman Julia J Tabor
Create a Home Valuation Report for This Property
The Home Valuation Report is an in-depth analysis detailing your home's value as well as a comparison with similar homes in the area
Home Values in the Area
Average Home Value in this Area
Purchase History
| Date | Buyer | Sale Price | Title Company |
|---|---|---|---|
| 10125 N 97Th Dr Llc | -- | None Listed On Document | |
| Boop Clayton M | $135,000 | Silo Title Agency | |
| Fink Lee Roy | -- | None Available | |
| Fink Lee Roy | -- | None Available | |
| Forman Julia J Tabor | -- | -- | |
| Forman Julia J Tabor | $40,000 | United Title Agency |
Source: Public Records
Mortgage History
| Date | Status | Borrower | Loan Amount |
|---|---|---|---|
| Previous Owner | Boop Clayton M | $108,000 |
Source: Public Records
Tax History Compared to Growth
Tax History
| Year | Tax Paid | Tax Assessment Tax Assessment Total Assessment is a certain percentage of the fair market value that is determined by local assessors to be the total taxable value of land and additions on the property. | Land | Improvement |
|---|---|---|---|---|
| 2025 | $483 | $6,209 | -- | -- |
| 2024 | $476 | $5,913 | -- | -- |
| 2023 | $476 | $17,310 | $3,460 | $13,850 |
| 2022 | $466 | $13,350 | $2,670 | $10,680 |
| 2021 | $499 | $11,610 | $2,320 | $9,290 |
| 2020 | $588 | $10,780 | $2,150 | $8,630 |
| 2019 | $570 | $9,580 | $1,910 | $7,670 |
| 2018 | $553 | $7,710 | $1,540 | $6,170 |
| 2017 | $552 | $6,350 | $1,270 | $5,080 |
| 2016 | $545 | $5,770 | $1,150 | $4,620 |
| 2015 | $508 | $5,760 | $1,150 | $4,610 |
Source: Public Records
Map
Nearby Homes
- 10134 N 97th Ave Unit B
- 10201 N 99th Ave Unit 32A
- 10201 N 99th Ave Unit 46
- 10201 N 99th Ave Unit 44
- 10201 N 99th Ave Unit 97
- 10201 N 99th Ave Unit 34
- 10201 N 99th Ave Unit 28A
- 10201 N 99th Ave Unit 49
- 10201 N 99th Ave Unit 129E
- 10201 N 99th Ave Unit 135F
- 10201 N 99th Ave Unit 3
- 10201 N 99th Ave Unit 160
- 10201 N 99th Ave Unit 149
- 10201 N 99th Ave Unit 2
- 10201 N 99th Ave Unit 33
- 10201 N 99th Ave Unit 152
- 10201 N 99th Ave Unit 21
- 10201 N 99th Ave Unit 96
- 9721 W Mountain View Rd
- 9616 W Mountain View Rd Unit A
- 10101 N 97th Dr
- 10101 N 97th Dr Unit B
- 10101 N 97th Dr Unit A
- 10101 N 97th Dr Unit A
- 10023 N 97th Dr Unit B
- 10023 N 97th Dr Unit A
- 10016 N 97th Ave
- 10016 N 97th Ave Unit A
- 10016 N 97th Ave Unit B
- 10109 N 97th Dr Unit B
- 10109 N 97th Dr Unit A
- 10024 N 97th Ave
- 10024 N 97th Ave Unit B
- 10024 N 97th Ave Unit A
- 10110 N 97th Dr Unit B
- 10110 N 97th Dr Unit A
- 10118 N 97th Dr Unit B
- 10118 N 97th Dr Unit A
- 10032 N 97th Ave Unit A
- 10032 N 97th Ave Unit B