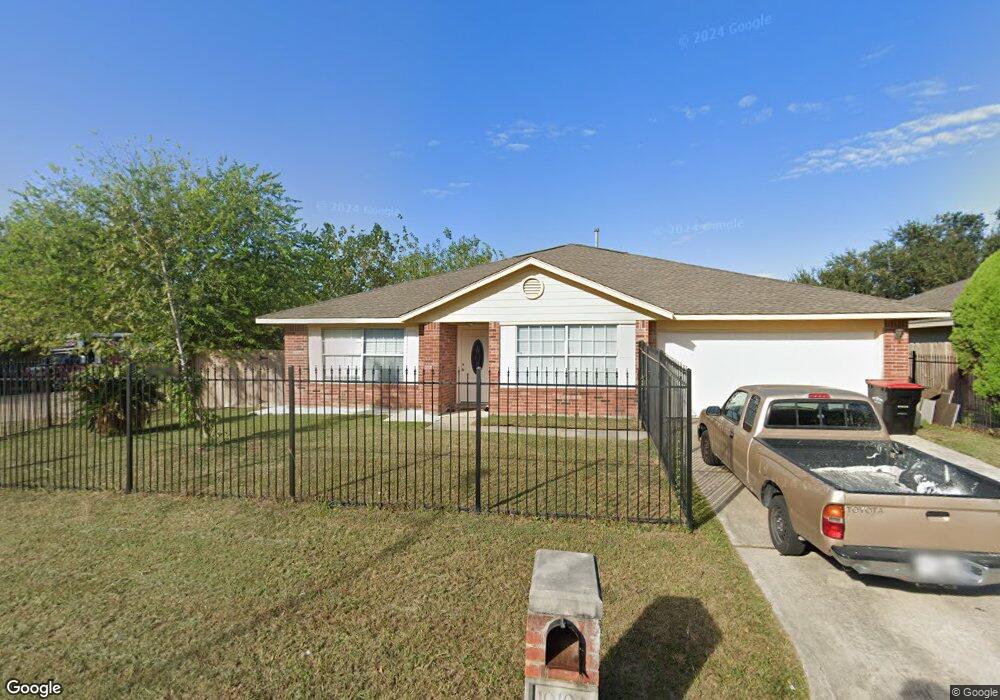
10103 Ridgecoral Ct Houston, TX 77038
North Houston NeighborhoodEstimated Value: $245,000 - $275,000
3
Beds
2
Baths
2,191
Sq Ft
$117/Sq Ft
Est. Value
About This Home
This home is located at 10103 Ridgecoral Ct, Houston, TX 77038 and is currently estimated at $256,265, approximately $116 per square foot. 10103 Ridgecoral Ct is a home located in Harris County with nearby schools including Jerry Keeble Ec/Pre-K, Gray Elementary School, and Aldine Ninth Grade School.
Ownership History
Date
Name
Owned For
Owner Type
Purchase Details
Closed on
Mar 24, 2017
Sold by
U S Bank National Assn
Bought by
Amaya Gerardo G
Current Estimated Value
Purchase Details
Closed on
Mar 20, 2017
Sold by
The Bank Of New York Mellon
Bought by
Us Bank Na and Nrz Pass Through Trust V
Purchase Details
Closed on
Dec 13, 2016
Sold by
Jacobs Curtis L and Jacobs Debra L
Bought by
Bank Of New York Mellon Trust Company N and Jpmorgan Chase Bank
Purchase Details
Closed on
Jul 18, 2002
Sold by
Roanoke Building Company Lp
Bought by
Jacobs Curtis L and Jacobs Debra L
Home Financials for this Owner
Home Financials are based on the most recent Mortgage that was taken out on this home.
Original Mortgage
$110,158
Interest Rate
6.73%
Purchase Details
Closed on
May 8, 2002
Sold by
Chatwood Place Lp
Bought by
Roanoke Building Company Lp
Create a Home Valuation Report for This Property
The Home Valuation Report is an in-depth analysis detailing your home's value as well as a comparison with similar homes in the area
Home Values in the Area
Average Home Value in this Area
Purchase History
| Date | Buyer | Sale Price | Title Company |
|---|---|---|---|
| Amaya Gerardo G | -- | None Available | |
| Us Bank Na | -- | None Available | |
| Bank Of New York Mellon Trust Company N | $145,000 | None Available | |
| Jacobs Curtis L | -- | Commonwealth Title | |
| Roanoke Building Company Lp | -- | -- |
Source: Public Records
Mortgage History
| Date | Status | Borrower | Loan Amount |
|---|---|---|---|
| Previous Owner | Jacobs Curtis L | $110,158 |
Source: Public Records
Tax History Compared to Growth
Tax History
| Year | Tax Paid | Tax Assessment Tax Assessment Total Assessment is a certain percentage of the fair market value that is determined by local assessors to be the total taxable value of land and additions on the property. | Land | Improvement |
|---|---|---|---|---|
| 2025 | $5,324 | $275,167 | $34,430 | $240,737 |
| 2024 | $5,324 | $275,167 | $34,430 | $240,737 |
| 2023 | $5,324 | $275,167 | $34,430 | $240,737 |
| 2022 | $3,752 | $162,955 | $23,399 | $139,556 |
| 2021 | $3,912 | $162,955 | $23,399 | $139,556 |
| 2020 | $4,166 | $162,955 | $23,399 | $139,556 |
| 2019 | $4,079 | $153,400 | $23,399 | $130,001 |
| 2018 | $2,225 | $154,981 | $13,371 | $141,610 |
| 2017 | $3,993 | $154,981 | $13,371 | $141,610 |
| 2016 | $3,621 | $140,537 | $13,371 | $127,166 |
| 2015 | $3,060 | $140,537 | $13,371 | $127,166 |
| 2014 | $3,060 | $136,734 | $13,371 | $123,363 |
Source: Public Records
Map
Nearby Homes
- 10134 Lasaber Ct
- 10026 Lasaber Ct
- 1006 Fruitvale Dr
- 1010 Francitas Dr
- 1022 Progreso Dr
- 10226 Ella Falls Blvd
- 1138 Cherry Spring Dr
- 939 Point Blank Dr
- 1506 Wilshire Park Dr
- 1219 Pilot Point Dr
- 9710 Debbie Ln
- 1019 Castolan Dr
- 1327 Fallbrook Dr
- 00 Fallbrook Dr
- 0 W Mt Houston Rd Unit 90464120
- 10519 Pleasanton Dr
- 10558 Pleasanton Dr
- 2115 Havencrest Dr
- 2203 Chalet Rd
- 0 Veterans Memorial Rd Unit 43555293
- 10107 Ridgecoral Ct
- 10051 Ridgecoral Ct
- 10102 Woodico Dr
- 10051 Ridgecoral Dr
- 10111 Ridgecoral Ct
- 10106 Woodico Dr
- 10049 Ridgecoral Ct
- 10049 Ridgecoral Dr
- 10050 Woodico Dr
- 10102 Ridgecoral Ct
- 10106 Ridgecoral Ct
- 10047 Ridgecoral Ct
- 10115 Ridgecoral Ct
- 10110 Woodico Dr
- 10046 Woodico Dr
- 10110 Ridgecoral Ct
- 10045 Ridgecoral Ct
- 10046 Ridgecoral Ct
- 10046 Ridgecoral Dr
- 10044 Woodico Dr