10105 Covell St Richmond, IL 60071
Estimated Value: $230,000 - $246,000
2
Beds
1
Bath
1,200
Sq Ft
$200/Sq Ft
Est. Value
About This Home
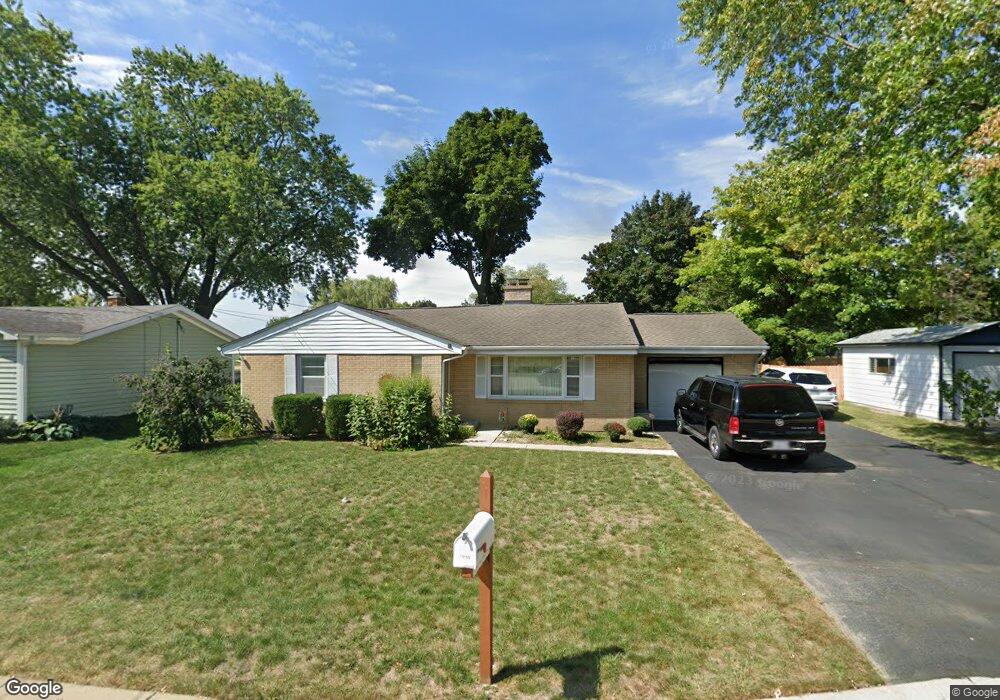
This home is located at 10105 Covell St, Richmond, IL 60071 and is currently estimated at $239,705, approximately $199 per square foot. 10105 Covell St is a home located in McHenry County with nearby schools including Richmond Grade School, Nippersink Middle School, and Richmond-Burton High School.
Ownership History
Date
Name
Owned For
Owner Type
Purchase Details
Closed on
Oct 30, 2009
Sold by
Turley Danlow Linda and Turley Linda A
Bought by
Robers Thomas G
Current Estimated Value
Home Financials for this Owner
Home Financials are based on the most recent Mortgage that was taken out on this home.
Original Mortgage
$127,645
Outstanding Balance
$83,645
Interest Rate
5.07%
Mortgage Type
FHA
Estimated Equity
$156,060
Purchase Details
Closed on
Mar 22, 2002
Sold by
Linnenkohl Lane W and Linnenkohl Ricki C
Bought by
Turley Linda A
Home Financials for this Owner
Home Financials are based on the most recent Mortgage that was taken out on this home.
Original Mortgage
$89,000
Interest Rate
6.95%
Purchase Details
Closed on
Jul 13, 1999
Sold by
Anderson Leif R and Wiedrich Laura
Bought by
Linnenkohl Lane W and Linnenkohl Ricki C
Home Financials for this Owner
Home Financials are based on the most recent Mortgage that was taken out on this home.
Original Mortgage
$90,900
Interest Rate
7.77%
Create a Home Valuation Report for This Property
The Home Valuation Report is an in-depth analysis detailing your home's value as well as a comparison with similar homes in the area
Home Values in the Area
Average Home Value in this Area
Purchase History
| Date | Buyer | Sale Price | Title Company |
|---|---|---|---|
| Robers Thomas G | $130,000 | Chicago Title Insurance Co | |
| Turley Linda A | $129,000 | Chicago Title Insurance Co | |
| Linnenkohl Lane W | $101,000 | -- |
Source: Public Records
Mortgage History
| Date | Status | Borrower | Loan Amount |
|---|---|---|---|
| Open | Robers Thomas G | $127,645 | |
| Previous Owner | Turley Linda A | $89,000 | |
| Previous Owner | Linnenkohl Lane W | $90,900 |
Source: Public Records
Tax History Compared to Growth
Tax History
| Year | Tax Paid | Tax Assessment Tax Assessment Total Assessment is a certain percentage of the fair market value that is determined by local assessors to be the total taxable value of land and additions on the property. | Land | Improvement |
|---|---|---|---|---|
| 2024 | $3,717 | $63,795 | $19,219 | $44,576 |
| 2023 | $3,492 | $58,319 | $17,569 | $40,750 |
| 2022 | $3,643 | $52,511 | $15,819 | $36,692 |
| 2021 | $3,483 | $50,399 | $15,183 | $35,216 |
| 2020 | $3,387 | $48,493 | $14,609 | $33,884 |
| 2019 | $3,511 | $46,935 | $14,140 | $32,795 |
| 2018 | $2,531 | $37,502 | $13,556 | $23,946 |
| 2017 | $2,470 | $35,713 | $12,909 | $22,804 |
| 2016 | $2,350 | $33,483 | $12,103 | $21,380 |
| 2013 | -- | $31,659 | $11,444 | $20,215 |
Source: Public Records
Map
Nearby Homes
- 5724 Milwaukee Ave
- 5814 Illinois 173
- 5510 Kenosha St
- 10910 Partridge Trail
- Newport - Two-story Plan at Sunset Ridge
- Madison - Two-story Plan at Sunset Ridge
- Jefferson - Two-story Plan at Sunset Ridge
- Monroe II - Two-story Plan at Sunset Ridge
- Truman III - Two-story Plan at Sunset Ridge
- Bradshaw - Two-story Plan at Sunset Ridge
- Dawson - Two-story Plan at Sunset Ridge
- Elway - Ranch Plan at Sunset Ridge
- Pasadena II - Ranch Plan at Sunset Ridge
- Harrison - Ranch Plan at Sunset Ridge
- Adams III - Ranch Plan at Sunset Ridge
- Lincoln - Ranch Plan at Sunset Ridge
- Roosevelt II - Ranch Plan at Sunset Ridge
- Roosevelt - Ranch Plan at Sunset Ridge
- Adams II - Ranch Plan at Sunset Ridge
- Marino - Ranch Plan at Sunset Ridge
- 10109 Covell St
- 10101 Covell St
- 10108 William St
- 10110 William St
- 10102 William St
- 10113 Covell St
- 5802 South St
- 10108 Covell St
- 10112 William St
- 5809 South St
- 10117 Covell St
- 10112 Covell St
- 5805 Milwaukee Ave
- 5811 South St
- 5723 Milwaukee Ave
- 5805 South St
- 5718 South St
- 5718 South St Unit LOWER
- 5718 South St Unit UPPER
- 0000 Covell St