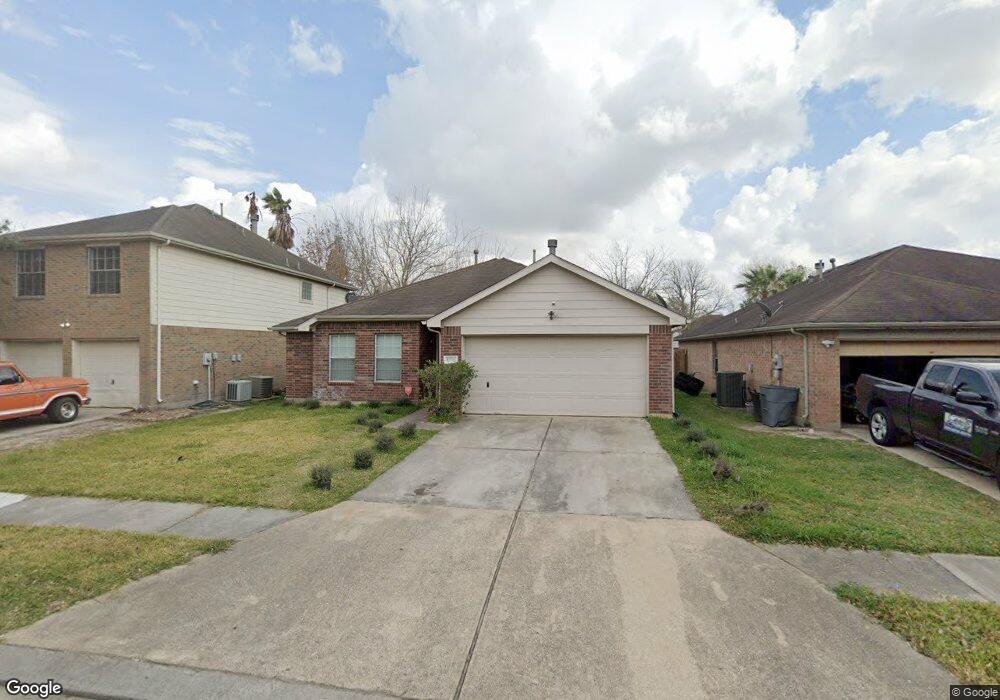
10106 Fallmont Ct Houston, TX 77086
North Houston NeighborhoodEstimated Value: $211,760 - $254,000
3
Beds
2
Baths
1,452
Sq Ft
$160/Sq Ft
Est. Value
About This Home
This home is located at 10106 Fallmont Ct, Houston, TX 77086 and is currently estimated at $232,690, approximately $160 per square foot. 10106 Fallmont Ct is a home located in Harris County with nearby schools including Kujawa EC/Pre-K/K School, Wilson Intermediate School, and Shotwell Middle School.
Ownership History
Date
Name
Owned For
Owner Type
Purchase Details
Closed on
Oct 1, 2022
Sold by
Kelly Corya Chea Trust
Bought by
Chea Kelly C
Current Estimated Value
Purchase Details
Closed on
Mar 20, 2018
Sold by
Chea Kelly
Bought by
Chea Kelly C and Kelly Corya Chea Trust
Purchase Details
Closed on
Apr 12, 2017
Sold by
Trans Propeties Mangment Inc
Bought by
Chea Kelly
Purchase Details
Closed on
Apr 30, 2014
Sold by
Nguyen Thu A and Nguyen Duong
Bought by
Trans Property Management Inc
Purchase Details
Closed on
Dec 19, 2012
Sold by
Hreal Company Llc
Bought by
Nguyen Thu and Nguyen Dunog
Purchase Details
Closed on
Nov 16, 2012
Sold by
Vabb Properties Llc
Bought by
Hreal Company Llc
Purchase Details
Closed on
Apr 22, 2003
Sold by
Kb Home Lone Star Lp
Bought by
Williams Keith R and Crachian Shawanna
Home Financials for this Owner
Home Financials are based on the most recent Mortgage that was taken out on this home.
Original Mortgage
$132,956
Interest Rate
5.57%
Mortgage Type
FHA
Create a Home Valuation Report for This Property
The Home Valuation Report is an in-depth analysis detailing your home's value as well as a comparison with similar homes in the area
Home Values in the Area
Average Home Value in this Area
Purchase History
| Date | Buyer | Sale Price | Title Company |
|---|---|---|---|
| Chea Kelly C | -- | -- | |
| Chea Kelly C | -- | None Available | |
| Chea Kelly | -- | None Available | |
| Trans Property Management Inc | -- | None Available | |
| Nguyen Thu | -- | Startex Title | |
| Hreal Company Llc | -- | Startex Title | |
| Hreal Company Llc | -- | Startex Title | |
| Williams Keith R | -- | First American Title Ins Co |
Source: Public Records
Mortgage History
| Date | Status | Borrower | Loan Amount |
|---|---|---|---|
| Previous Owner | Williams Keith R | $132,956 |
Source: Public Records
Tax History Compared to Growth
Tax History
| Year | Tax Paid | Tax Assessment Tax Assessment Total Assessment is a certain percentage of the fair market value that is determined by local assessors to be the total taxable value of land and additions on the property. | Land | Improvement |
|---|---|---|---|---|
| 2025 | $4,975 | $213,676 | $33,313 | $180,363 |
| 2024 | $4,975 | $215,100 | $33,313 | $181,787 |
| 2023 | $4,975 | $215,100 | $34,125 | $180,975 |
| 2022 | $4,166 | $171,149 | $26,250 | $144,899 |
| 2021 | $3,521 | $145,000 | $26,250 | $118,750 |
| 2020 | $3,967 | $146,943 | $26,250 | $120,693 |
| 2019 | $3,731 | $132,909 | $18,375 | $114,534 |
| 2018 | $1,737 | $121,000 | $18,375 | $102,625 |
| 2017 | $3,347 | $123,655 | $18,375 | $105,280 |
| 2016 | $3,170 | $117,126 | $18,375 | $98,751 |
| 2015 | $2,396 | $105,027 | $18,375 | $86,652 |
| 2014 | $2,396 | $88,417 | $18,375 | $70,042 |
Source: Public Records
Map
Nearby Homes
- 5914 Stirring Winds Ln
- 3265 Frick Rd
- 12623 Ann Louise Rd
- 10730 Antoine Dr
- 6411 Halstead Meadows Cir
- 00 Essie Rd
- 3127 Frick Rd
- 10214 Trade Winds Dr
- 13308 Ann Louise Rd
- 6706 Redding Springs Ln
- 6703 Deer Ridge Ln
- 10306 Jillana Kaye Dr
- 13518 Kaltenbrun Rd
- 00 Romona Blvd
- 2838 Packard Elm St
- 2835 Oakland Brook St
- 6502 Trail Valley Way
- 6830 Desert Rose Ln
- 2831 Oakland Brook St
- 2811 Oakland Brook St
- 10110 Fallmont Ct
- 10102 Fallmont Ct
- 10114 Fallmont Ct
- 10107 Fallmont Cir
- 10111 Fallmont Cir
- 10115 Fallmont Cir
- 10111 Fallmont Ct
- 10107 Fallmont Ct
- 10119 Fallmont Cir
- 10115 Fallmont Ct
- 10118 Fallmont Ct
- 10103 Fallmont Ct
- 5915 Fallmont Dr
- 5919 Fallmont Dr
- 10119 Fallmont Ct
- 5911 Fallmont Dr
- 10123 Fallmont Cir
- 5923 Fallmont Dr
- 5907 Fallmont Dr
- 10122 Fallmont Ct