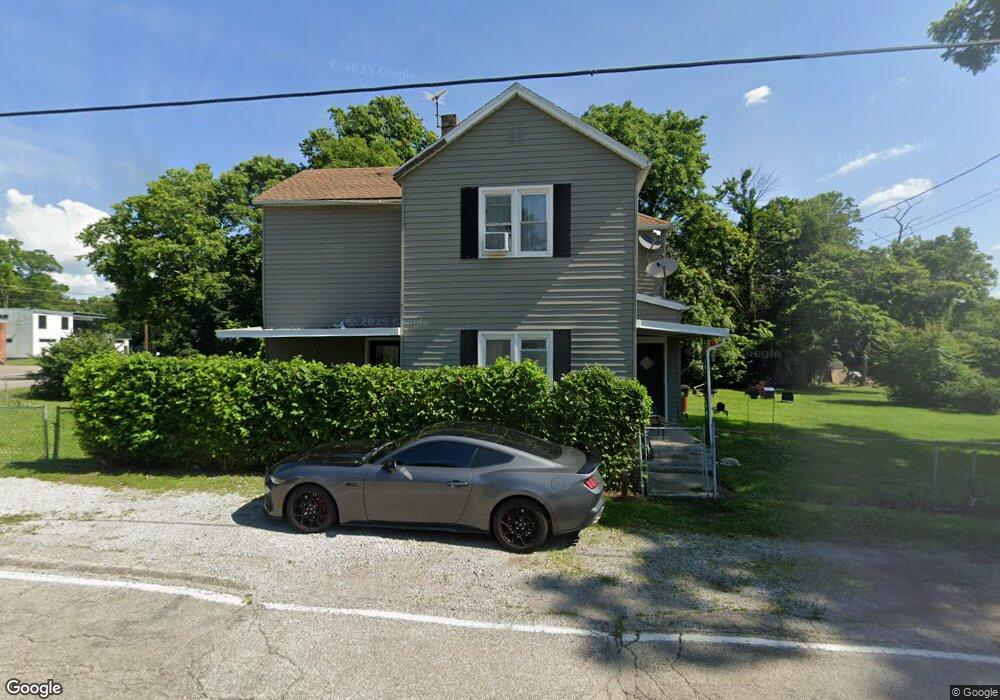
10106 Lincoln Rd Camp Dennison, OH 45111
Estimated Value: $191,000 - $270,000
3
Beds
2
Baths
1,586
Sq Ft
$140/Sq Ft
Est. Value
About This Home
This home is located at 10106 Lincoln Rd, Camp Dennison, OH 45111 and is currently estimated at $222,115, approximately $140 per square foot. 10106 Lincoln Rd is a home located in Hamilton County with nearby schools including Indian Hill Primary School, Indian Hill Elementary School, and Indian Hill Middle School.
Ownership History
Date
Name
Owned For
Owner Type
Purchase Details
Closed on
Sep 15, 2025
Sold by
Mallery John and Cenci Adrienne
Bought by
Hartig Richard Lucas
Current Estimated Value
Home Financials for this Owner
Home Financials are based on the most recent Mortgage that was taken out on this home.
Original Mortgage
$13,480
Outstanding Balance
$13,468
Interest Rate
6.72%
Estimated Equity
$208,647
Purchase Details
Closed on
Dec 14, 2022
Sold by
Ckk Properties Llc
Bought by
Mallery John and Cenci Adrienne
Purchase Details
Closed on
Jun 17, 2021
Sold by
Raines Bessie
Bought by
Ckk Properties Llc
Home Financials for this Owner
Home Financials are based on the most recent Mortgage that was taken out on this home.
Original Mortgage
$136,800
Interest Rate
2.9%
Mortgage Type
Purchase Money Mortgage
Purchase Details
Closed on
Feb 29, 2012
Sold by
Estate Of Bessie V Richmond
Bought by
Raines Bessie
Purchase Details
Closed on
Jun 20, 2002
Sold by
Raines Bessie M
Bought by
Richmond Bessie
Create a Home Valuation Report for This Property
The Home Valuation Report is an in-depth analysis detailing your home's value as well as a comparison with similar homes in the area
Home Values in the Area
Average Home Value in this Area
Purchase History
| Date | Buyer | Sale Price | Title Company |
|---|---|---|---|
| Hartig Richard Lucas | $269,600 | Columbia Title | |
| Mallery John | $111,540 | -- | |
| Ckk Properties Llc | $152,000 | American Homeland Title | |
| Raines Bessie | -- | Attorney | |
| Richmond Bessie | $68,800 | -- |
Source: Public Records
Mortgage History
| Date | Status | Borrower | Loan Amount |
|---|---|---|---|
| Open | Hartig Richard Lucas | $13,480 | |
| Open | Hartig Richard Lucas | $264,716 | |
| Previous Owner | Ckk Properties Llc | $136,800 |
Source: Public Records
Tax History Compared to Growth
Tax History
| Year | Tax Paid | Tax Assessment Tax Assessment Total Assessment is a certain percentage of the fair market value that is determined by local assessors to be the total taxable value of land and additions on the property. | Land | Improvement |
|---|---|---|---|---|
| 2024 | $1,791 | $39,040 | $15,677 | $23,363 |
| 2023 | $1,749 | $39,040 | $15,677 | $23,363 |
| 2022 | $2,325 | $39,040 | $14,144 | $24,896 |
| 2021 | $2,141 | $39,040 | $14,144 | $24,896 |
| 2020 | $1,897 | $39,040 | $14,144 | $24,896 |
| 2019 | $1,790 | $36,148 | $13,097 | $23,051 |
| 2018 | $1,792 | $36,148 | $13,097 | $23,051 |
| 2017 | $1,727 | $36,148 | $13,097 | $23,051 |
| 2016 | $1,563 | $31,990 | $13,489 | $18,501 |
| 2015 | $1,551 | $31,990 | $13,489 | $18,501 |
| 2014 | $1,523 | $31,990 | $13,489 | $18,501 |
| 2013 | $1,533 | $31,059 | $13,097 | $17,962 |
Source: Public Records
Map
Nearby Homes
- 221 Miami Lakes Dr
- 5 White Water Way
- 18 Big Oak Ln
- 674 Hobby Horse Ln
- 5763 Price Rd
- 8200 Kroger Farm Rd
- 764 Forest Ave
- 732 St Rt 28
- 12 Valley View Cir
- 772 Price Knoll Ln
- 574 Main St
- Hoover Plan at Hawley Farms
- Rockford Plan at Hawley Farms
- Truman Plan at Hawley Farms
- Longwood Plan at Hawley Farms
- Avalon Plan at Hawley Farms
- Somerset Plan at Hawley Farms
- Sanibel Plan at Hawley Farms
- Dallas Plan at Hawley Farms
- Carlisle Plan at Hawley Farms
- 7864 Glendale Milford Rd
- 10126 Lincoln Rd
- Lot Lincoln Rd
- 7832 Glendale Milford Rd
- 7876 Glendale Milford Rd
- 7814 Glendale Milford Rd
- 10128 Lincoln Rd
- 10128 Lincoln Rd
- 10123 Campbell St
- 10123 Lincoln Rd
- 7890 Glendale Milford Rd
- 10132 Lincoln Rd
- 7873 Glendale Milford Rd
- 10081 Lincoln Rd
- 10131 Campbell St
- 10136 Lincoln Rd
- 7809 Glendale Milford Rd
- 7891 Glendale Milford Rd
- 7910 Glendale Milford Rd
- 0 Campbell Ave Unit 1171454