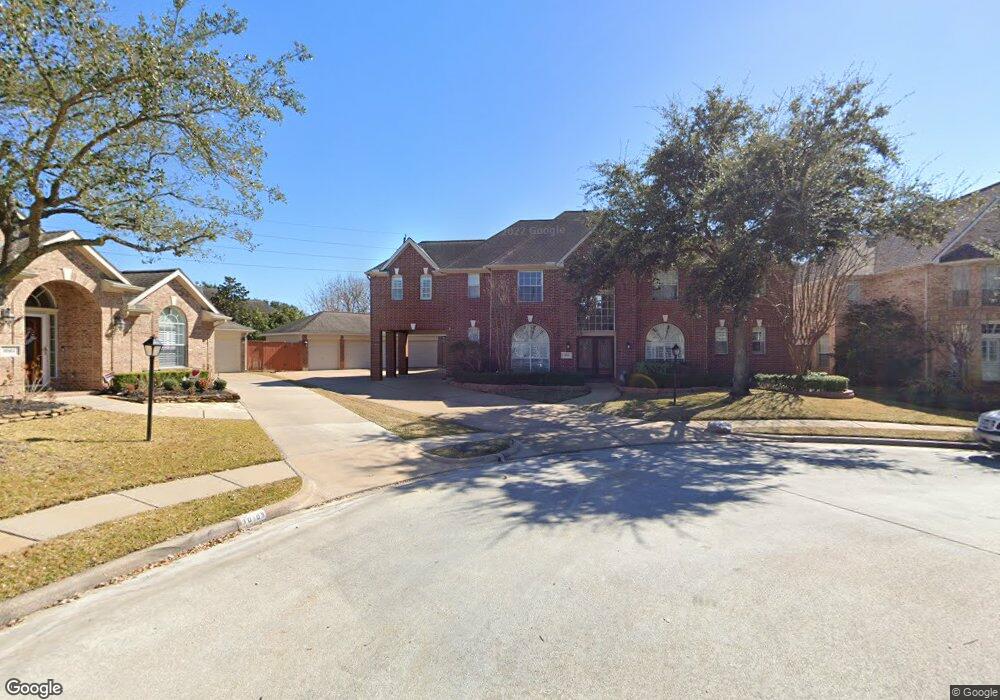
10107 Ballinger Cir Houston, TX 77064
Estimated Value: $483,000 - $524,000
4
Beds
4
Baths
4,011
Sq Ft
$126/Sq Ft
Est. Value
About This Home
This home is located at 10107 Ballinger Cir, Houston, TX 77064 and is currently estimated at $503,464, approximately $125 per square foot. 10107 Ballinger Cir is a home located in Harris County with nearby schools including Gleason Elementary School, Cook Middle School, and Jersey Village High School.
Ownership History
Date
Name
Owned For
Owner Type
Purchase Details
Closed on
Jul 20, 2010
Sold by
Weichert Relocation Resources Inc
Bought by
Cherechinsky David A and Cherechinsky Tara M
Current Estimated Value
Home Financials for this Owner
Home Financials are based on the most recent Mortgage that was taken out on this home.
Original Mortgage
$250,000
Interest Rate
4.69%
Mortgage Type
New Conventional
Purchase Details
Closed on
Jul 15, 2010
Sold by
Chesebro Scott B and Chesebro Michelle G
Bought by
Weichert Relocation Resources Inc
Home Financials for this Owner
Home Financials are based on the most recent Mortgage that was taken out on this home.
Original Mortgage
$250,000
Interest Rate
4.69%
Mortgage Type
New Conventional
Purchase Details
Closed on
Aug 18, 1997
Sold by
Centex Homes
Bought by
Chesebro Scott B and Chesebro Michelle S
Home Financials for this Owner
Home Financials are based on the most recent Mortgage that was taken out on this home.
Original Mortgage
$190,000
Interest Rate
7.47%
Create a Home Valuation Report for This Property
The Home Valuation Report is an in-depth analysis detailing your home's value as well as a comparison with similar homes in the area
Home Values in the Area
Average Home Value in this Area
Purchase History
| Date | Buyer | Sale Price | Title Company |
|---|---|---|---|
| Cherechinsky David A | -- | Chicago Title | |
| Weichert Relocation Resources Inc | -- | Chicago Title | |
| Chesebro Scott B | -- | -- |
Source: Public Records
Mortgage History
| Date | Status | Borrower | Loan Amount |
|---|---|---|---|
| Closed | Cherechinsky David A | $250,000 | |
| Previous Owner | Chesebro Scott B | $190,000 |
Source: Public Records
Tax History Compared to Growth
Tax History
| Year | Tax Paid | Tax Assessment Tax Assessment Total Assessment is a certain percentage of the fair market value that is determined by local assessors to be the total taxable value of land and additions on the property. | Land | Improvement |
|---|---|---|---|---|
| 2025 | $7,161 | $519,849 | $88,340 | $431,509 |
| 2024 | $7,161 | $463,501 | $80,460 | $383,041 |
| 2023 | $7,161 | $519,143 | $80,460 | $438,683 |
| 2022 | $9,962 | $445,394 | $67,188 | $378,206 |
| 2021 | $9,560 | $379,236 | $67,188 | $312,048 |
| 2020 | $10,047 | $382,837 | $44,792 | $338,045 |
| 2019 | $10,048 | $371,350 | $44,792 | $326,558 |
| 2018 | $3,879 | $367,983 | $44,792 | $323,191 |
| 2017 | $9,959 | $460,696 | $44,792 | $415,904 |
| 2016 | $9,930 | $460,696 | $44,792 | $415,904 |
| 2015 | $8,645 | $333,558 | $44,792 | $288,766 |
| 2014 | $8,645 | $373,188 | $44,792 | $328,396 |
Source: Public Records
Map
Nearby Homes
- 8822 Ballinger Dr
- 9530 Tarrant Ct
- 9715 Therrell Dr
- 9619 Therrell Dr
- 8511 Parmer Ct
- 8918 Burleson Ct
- 15817 Honolulu St
- 10223 Dude Rd
- 8 Epernay Place
- 16105 Crawford St
- 9314 Tascosa Ln
- 9302 Stone Porch Ln
- 9203 Cabin Creek Dr
- 9210 Skipping Stone Ln
- 9106 Stone Porch Ln
- 9219 Chester Park Dr
- 10410 Dude Rd
- 9135 Eaglecove Dr
- 9203 S Pass Ln
- 16218 Capri Dr
- 10111 Ballinger Cir
- 10103 Ballinger Cir
- 8606 Ballinger Dr
- 9819 Ricaby Dr
- 8610 Ballinger Dr
- 9815 Ricaby Dr
- 9823 Ricaby Dr
- 10102 Ballinger Cir
- 10110 Ballinger Cir
- 10106 Ballinger Cir
- 9915 Willowbridge Park Blvd
- 9911 Willowbridge Park Blvd
- 8631 Ballinger Dr
- 8635 Ballinger Dr
- 8627 Ballinger Dr
- 9919 Willowbridge Park Blvd
- 8623 Ballinger Dr
- 9818 Ricaby Dr
- 8643 Ballinger Dr
- 9814 Ricaby Dr