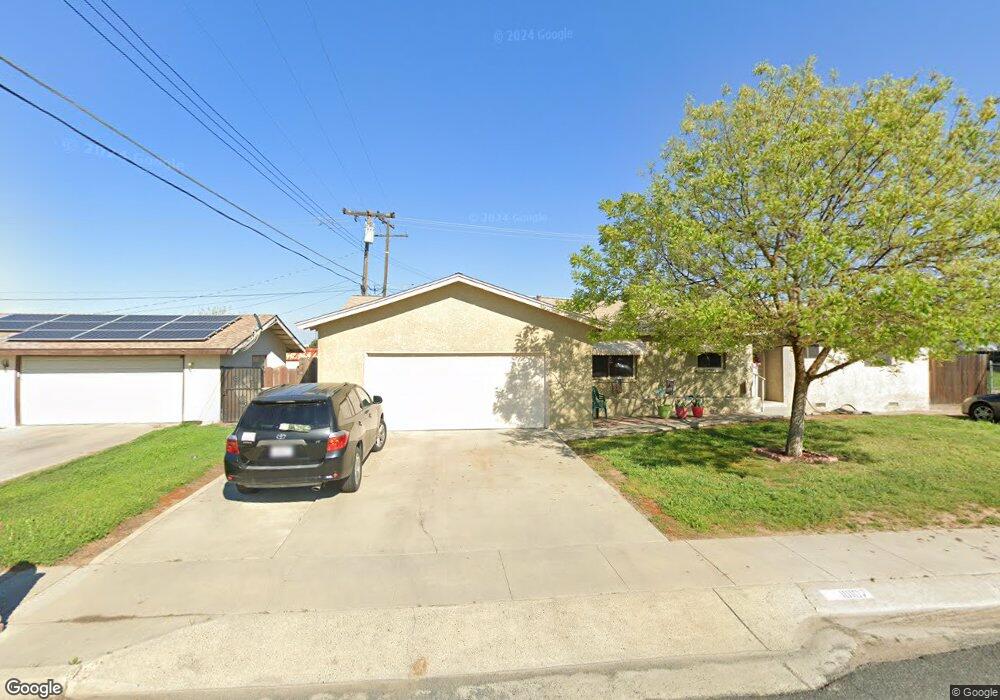
10107 David St Hanford, CA 93230
Estimated Value: $328,000 - $365,000
3
Beds
3
Baths
1,878
Sq Ft
$182/Sq Ft
Est. Value
About This Home
This home is located at 10107 David St, Hanford, CA 93230 and is currently estimated at $341,053, approximately $181 per square foot. 10107 David St is a home located in Kings County with nearby schools including Kit Carson Elementary School, Hanford High School, and Heritage Christian Academy.
Ownership History
Date
Name
Owned For
Owner Type
Purchase Details
Closed on
Mar 18, 1998
Sold by
Hw Osullivan John P and Hw Letha B
Bought by
Huff Ernie R and Huff Cheryl V
Current Estimated Value
Home Financials for this Owner
Home Financials are based on the most recent Mortgage that was taken out on this home.
Original Mortgage
$90,270
Outstanding Balance
$16,572
Interest Rate
7.06%
Mortgage Type
VA
Estimated Equity
$324,481
Create a Home Valuation Report for This Property
The Home Valuation Report is an in-depth analysis detailing your home's value as well as a comparison with similar homes in the area
Home Values in the Area
Average Home Value in this Area
Purchase History
| Date | Buyer | Sale Price | Title Company |
|---|---|---|---|
| Huff Ernie R | $88,500 | Hanford Title Co |
Source: Public Records
Mortgage History
| Date | Status | Borrower | Loan Amount |
|---|---|---|---|
| Open | Huff Ernie R | $90,270 |
Source: Public Records
Tax History
| Year | Tax Paid | Tax Assessment Tax Assessment Total Assessment is a certain percentage of the fair market value that is determined by local assessors to be the total taxable value of land and additions on the property. | Land | Improvement |
|---|---|---|---|---|
| 2025 | $1,394 | $141,315 | $39,919 | $101,396 |
| 2023 | $1,394 | $135,829 | $38,370 | $97,459 |
| 2022 | $1,539 | $133,167 | $37,618 | $95,549 |
| 2021 | $1,512 | $130,557 | $36,881 | $93,676 |
| 2020 | $1,511 | $129,218 | $36,503 | $92,715 |
| 2019 | $1,497 | $126,684 | $35,787 | $90,897 |
| 2018 | $1,469 | $124,200 | $35,085 | $89,115 |
| 2017 | $1,450 | $121,765 | $34,397 | $87,368 |
| 2016 | $1,412 | $119,378 | $33,723 | $85,655 |
| 2015 | $1,393 | $117,584 | $33,216 | $84,368 |
| 2014 | $1,383 | $115,280 | $32,565 | $82,715 |
Source: Public Records
Map
Nearby Homes
- 8625 La Vaca Way
- 10125 El Toro Way
- 8650 Lacey Blvd
- 9837 9 1 4 Ave
- 1205 Hawthorn St
- 1 E 3rd St
- 1326 Elm Ct
- 1295 Lassen Dr
- 98379 9 1 4 Ave
- 803 Gladys Way
- 1340 Waterview St
- 1735 S Harris St
- 1759 S Harris St
- 1771 S Harris St
- 605 E Myrtle St
- 1915 Valley Springs Ave
- 311 E 4th St
- 860 E Grangeville Spc 113 Blvd
- 211 E 7th St
- 233 E 7th St
Your Personal Tour Guide
Ask me questions while you tour the home.