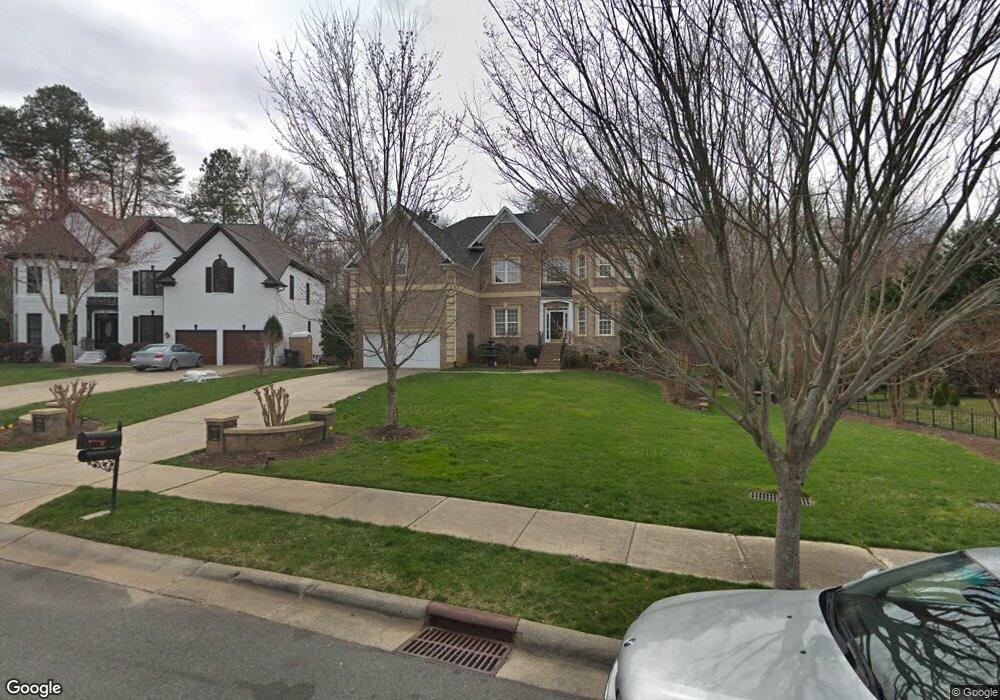
10108 Squires Way Cornelius, NC 28031
Estimated Value: $931,000 - $1,714,000
4
Beds
4
Baths
6,620
Sq Ft
$199/Sq Ft
Est. Value
About This Home
This home is located at 10108 Squires Way, Cornelius, NC 28031 and is currently estimated at $1,320,356, approximately $199 per square foot. 10108 Squires Way is a home located in Mecklenburg County with nearby schools including J.V. Washam Elementary School, Bailey Middle School, and William Amos Hough High School.
Ownership History
Date
Name
Owned For
Owner Type
Purchase Details
Closed on
Mar 28, 2024
Sold by
Brown Daniel B
Bought by
Daniel B Brown Revocable Trust and Brown
Current Estimated Value
Purchase Details
Closed on
Oct 22, 2021
Sold by
Cook Gena Nadine Brown
Bought by
Brown Daniel B
Purchase Details
Closed on
Oct 15, 2021
Sold by
Brown Christopher Michael and Brown Irrevocable Trust
Bought by
Cook Gena Nadine Brown
Purchase Details
Closed on
May 13, 2021
Sold by
Brown Daniel B and Brown Rita L
Bought by
Brown Christopher Michael and Brown Irrevocable Trust
Purchase Details
Closed on
Mar 8, 2006
Sold by
Brown Daniel B and Brown Rita L
Bought by
Brown Daniel B and Brown Rita L
Purchase Details
Closed on
Oct 20, 2004
Sold by
Peachtree Residential Properties Llc
Bought by
Moore Daniel B and Moore Rita L
Create a Home Valuation Report for This Property
The Home Valuation Report is an in-depth analysis detailing your home's value as well as a comparison with similar homes in the area
Home Values in the Area
Average Home Value in this Area
Purchase History
| Date | Buyer | Sale Price | Title Company |
|---|---|---|---|
| Daniel B Brown Revocable Trust | -- | None Listed On Document | |
| Daniel B Brown Revocable Trust | -- | None Listed On Document | |
| Brown Daniel B | -- | None Available | |
| Cook Gena Nadine Brown | -- | None Available | |
| Brown Christopher Michael | -- | None Available | |
| Brown Daniel B | -- | None Available | |
| Moore Daniel B | $436,000 | -- |
Source: Public Records
Tax History Compared to Growth
Tax History
| Year | Tax Paid | Tax Assessment Tax Assessment Total Assessment is a certain percentage of the fair market value that is determined by local assessors to be the total taxable value of land and additions on the property. | Land | Improvement |
|---|---|---|---|---|
| 2025 | $5,826 | $880,300 | $85,000 | $795,300 |
| 2024 | $5,826 | $880,300 | $85,000 | $795,300 |
| 2023 | $5,733 | $880,300 | $85,000 | $795,300 |
| 2022 | $5,415 | $633,200 | $85,000 | $548,200 |
| 2021 | $5,351 | $633,200 | $85,000 | $548,200 |
| 2020 | $5,351 | $633,200 | $85,000 | $548,200 |
| 2019 | $5,345 | $633,200 | $85,000 | $548,200 |
| 2018 | $4,728 | $436,000 | $75,000 | $361,000 |
| 2017 | $4,692 | $436,000 | $75,000 | $361,000 |
| 2016 | $4,689 | $436,000 | $75,000 | $361,000 |
| 2015 | $4,620 | $436,000 | $75,000 | $361,000 |
| 2014 | $4,618 | $0 | $0 | $0 |
Source: Public Records
Map
Nearby Homes
- 10104 Treetop Ln
- 10304 Squires Way
- 2224 Lantern Way Cir
- 20209 Floral Ln
- 20125 Floral Ln
- 10416 Audubon Ridge Dr Unit 4
- 10415 Danesway Ln
- 19924 Floral Ln
- 10432 Audubon Ridge Dr
- 20437 Willow Pond Rd
- 21108 Townwood Dr
- 8920 Lake Pines Dr
- 19603 Whilehaven Ct
- 10125 Meadow Crossing Ln
- 20807 Willow Pond Rd
- 10606 Danesway Ln
- 18200 Statesville Rd
- 11613 Truan Ln
- 10701 Washam Potts Rd
- Lot 9 Meridian St Unit 9
- 10114 Squires Way
- 20122 Coachmans Wood Ln
- 20128 Coachmans Wood Ln
- 20128 Coachmans Wood Ln Unit 37
- 20116 Coachmans Wood Ln
- 10120 Squires Way
- 20110 Coachmans Wood Ln
- 9303 Peachway Dr
- 10101 Squires Way
- 10126 Squires Way
- 20125 Coachmans Wood Ln Unit 47
- 20125 Coachmans Wood Ln
- 9307 Peachway Dr
- 20115 Coachmans Wood Ln
- 20106 Coachmans Wood Ln
- 19831 Coachmans Trace
- 10132 Squires Way
- 10129 Squires Way
- 20109 Coachmans Wood Ln
- 19842 Coachmans Trace