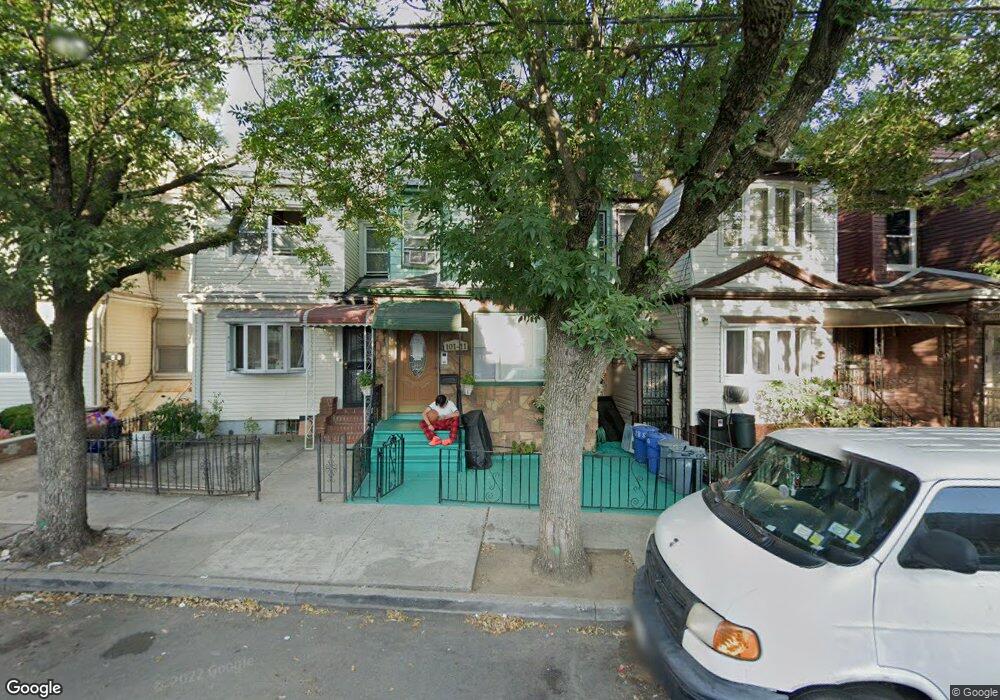
10109 78th St Ozone Park, NY 11416
Ozone Park NeighborhoodEstimated Value: $778,000 - $982,000
--
Bed
--
Bath
2,158
Sq Ft
$413/Sq Ft
Est. Value
About This Home
This home is located at 10109 78th St, Ozone Park, NY 11416 and is currently estimated at $890,614, approximately $412 per square foot. 10109 78th St is a home located in Queens County with nearby schools including P.S. 63 - Old South, Jhs 210 Elizabeth Blackwell, and Cypress Hills Ascend Charter Lower School.
Ownership History
Date
Name
Owned For
Owner Type
Purchase Details
Closed on
Feb 8, 2008
Sold by
Rahman Shafiqur
Bought by
Rahman Kabibur and Rahman Shafiqur
Current Estimated Value
Purchase Details
Closed on
Oct 31, 2006
Sold by
Tsang Ea Fong
Bought by
Rahman Shafiqur
Home Financials for this Owner
Home Financials are based on the most recent Mortgage that was taken out on this home.
Original Mortgage
$444,000
Interest Rate
6.33%
Mortgage Type
Purchase Money Mortgage
Purchase Details
Closed on
Jan 12, 2004
Sold by
Tsang Ea Fong and Tsang Lin-Dee
Bought by
Tsang Ea Fong
Create a Home Valuation Report for This Property
The Home Valuation Report is an in-depth analysis detailing your home's value as well as a comparison with similar homes in the area
Home Values in the Area
Average Home Value in this Area
Purchase History
| Date | Buyer | Sale Price | Title Company |
|---|---|---|---|
| Rahman Kabibur | -- | -- | |
| Rahman Kabibur | -- | -- | |
| Rahman Shafiqur | $555,000 | -- | |
| Rahman Shafiqur | $555,000 | -- | |
| Tsang Ea Fong | -- | -- | |
| Tsang Ea Fong | -- | -- |
Source: Public Records
Mortgage History
| Date | Status | Borrower | Loan Amount |
|---|---|---|---|
| Previous Owner | Rahman Shafiqur | $444,000 |
Source: Public Records
Tax History Compared to Growth
Tax History
| Year | Tax Paid | Tax Assessment Tax Assessment Total Assessment is a certain percentage of the fair market value that is determined by local assessors to be the total taxable value of land and additions on the property. | Land | Improvement |
|---|---|---|---|---|
| 2025 | $6,990 | $38,374 | $11,719 | $26,655 |
| 2024 | $7,002 | $36,202 | $11,684 | $24,518 |
| 2023 | $6,920 | $35,856 | $11,598 | $24,258 |
| 2022 | $6,579 | $52,320 | $17,700 | $34,620 |
| 2021 | $6,580 | $45,900 | $17,700 | $28,200 |
| 2020 | $6,473 | $43,320 | $17,700 | $25,620 |
| 2019 | $6,018 | $40,680 | $17,700 | $22,980 |
| 2018 | $5,793 | $29,880 | $13,235 | $16,645 |
| 2017 | $5,543 | $28,663 | $14,834 | $13,829 |
| 2016 | $5,133 | $28,663 | $14,834 | $13,829 |
| 2015 | $3,042 | $26,648 | $17,436 | $9,212 |
| 2014 | $3,042 | $25,140 | $19,080 | $6,060 |
Source: Public Records
Map
Nearby Homes