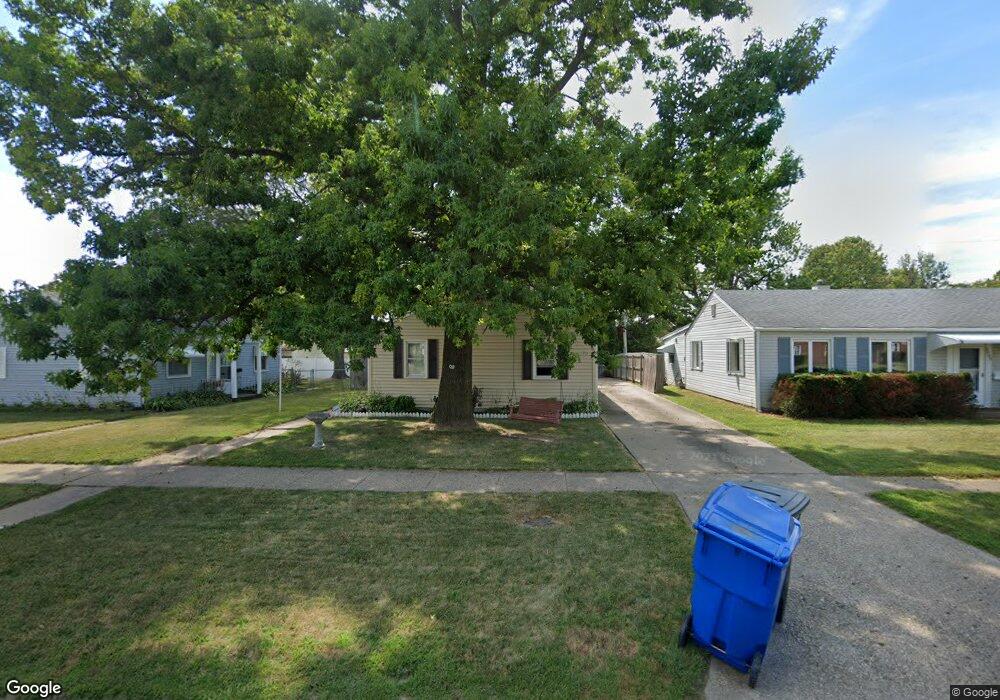
1011 41st St Moline, IL 61265
Estimated Value: $111,619 - $119,000
Studio
--
Bath
876
Sq Ft
$131/Sq Ft
Est. Value
About This Home
This home is located at 1011 41st St, Moline, IL 61265 and is currently estimated at $115,155, approximately $131 per square foot. 1011 41st St is a home located in Rock Island County with nearby schools including George Washington Elementary School, Woodrow Wilson Middle School, and Moline Sr High School.
Ownership History
Date
Name
Owned For
Owner Type
Purchase Details
Closed on
Jun 24, 2021
Sold by
Dean Kathleen A
Bought by
Costello John F
Current Estimated Value
Home Financials for this Owner
Home Financials are based on the most recent Mortgage that was taken out on this home.
Original Mortgage
$102,300
Outstanding Balance
$92,764
Interest Rate
3%
Mortgage Type
VA
Estimated Equity
$22,391
Create a Home Valuation Report for This Property
The Home Valuation Report is an in-depth analysis detailing your home's value as well as a comparison with similar homes in the area
Home Values in the Area
Average Home Value in this Area
Purchase History
| Date | Buyer | Sale Price | Title Company |
|---|---|---|---|
| Costello John F | $100,000 | Ames John G |
Source: Public Records
Mortgage History
| Date | Status | Borrower | Loan Amount |
|---|---|---|---|
| Open | Costello John F | $102,300 |
Source: Public Records
Tax History
| Year | Tax Paid | Tax Assessment Tax Assessment Total Assessment is a certain percentage of the fair market value that is determined by local assessors to be the total taxable value of land and additions on the property. | Land | Improvement |
|---|---|---|---|---|
| 2024 | $3,026 | $40,702 | $7,516 | $33,186 |
| 2023 | $3,026 | $37,479 | $6,921 | $30,558 |
| 2022 | $2,427 | $33,038 | $6,182 | $26,856 |
| 2021 | $1,360 | $31,585 | $5,910 | $25,675 |
| 2020 | $1,376 | $31,057 | $5,811 | $25,246 |
| 2019 | $1,386 | $30,567 | $5,719 | $24,848 |
| 2018 | $1,371 | $27,401 | $5,633 | $21,768 |
| 2017 | $1,369 | $26,969 | $5,544 | $21,425 |
| 2016 | $1,377 | $26,133 | $5,372 | $20,761 |
| 2015 | $1,377 | $25,540 | $5,250 | $20,290 |
| 2014 | $458 | $25,795 | $5,302 | $20,493 |
| 2013 | $458 | $25,795 | $5,302 | $20,493 |
Source: Public Records
Map
Nearby Homes
- 4118 10th Ave
- 4202 10th Ave
- 3814 10th Avenue Ct
- 1144 39th St
- 3807 10th Avenue Place
- 3810 11th Ave
- 1103 37th Street Ct
- 906 40th Street Ct
- 4216 13th Ave
- 3709 9th Ave
- 3658 15th Avenue Ct
- 4610 8th Ave
- 1208 35th Street Dr Unit M
- 3618 15th Avenue Ct
- 4301 17th Ave
- 4510 5th Ave
- 4220 18th Ave
- 1700 46th St
- 411 39th St
- 1814 36th St
Your Personal Tour Guide
Ask me questions while you tour the home.