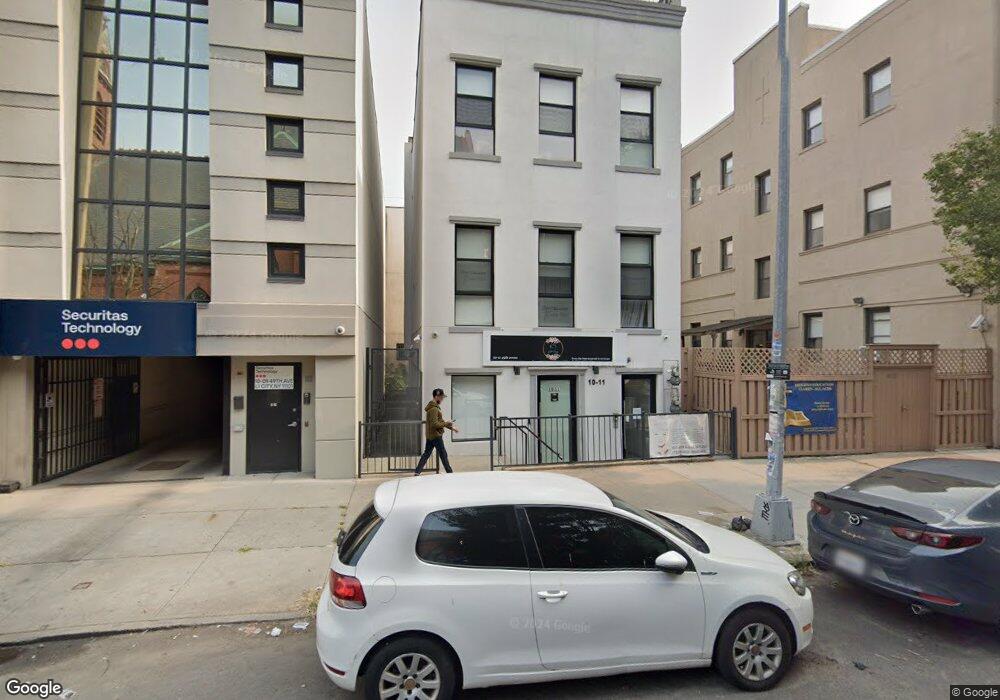
1011 49th Ave Long Island City, NY 11101
Hunters Point NeighborhoodEstimated Value: $2,592,332
--
Bed
--
Bath
3,289
Sq Ft
$788/Sq Ft
Est. Value
About This Home
This home is located at 1011 49th Ave, Long Island City, NY 11101 and is currently estimated at $2,592,332, approximately $788 per square foot. 1011 49th Ave is a home located in Queens County with nearby schools including P.S./I.S. 78Q Early Childhood Center, I.S. 204 Oliver W. Holmes, and Long Island City High School.
Ownership History
Date
Name
Owned For
Owner Type
Purchase Details
Closed on
Apr 18, 2022
Sold by
J49 Avenue Llc
Bought by
Ch Forever Llc and Cj Team Llc
Current Estimated Value
Home Financials for this Owner
Home Financials are based on the most recent Mortgage that was taken out on this home.
Original Mortgage
$1,020,228
Outstanding Balance
$965,544
Interest Rate
5%
Mortgage Type
Purchase Money Mortgage
Estimated Equity
$1,626,789
Purchase Details
Closed on
Apr 23, 2014
Sold by
Salerni Robert and Salerni Rosemarie
Bought by
J49 Avenue Llc
Home Financials for this Owner
Home Financials are based on the most recent Mortgage that was taken out on this home.
Original Mortgage
$845,000
Interest Rate
4.41%
Mortgage Type
Commercial
Purchase Details
Closed on
Oct 26, 2007
Sold by
Estate Of Guerino Salerni
Bought by
Salerni Robert and Salerni Rosemarie
Home Financials for this Owner
Home Financials are based on the most recent Mortgage that was taken out on this home.
Original Mortgage
$150,000
Interest Rate
6.41%
Mortgage Type
Commercial
Create a Home Valuation Report for This Property
The Home Valuation Report is an in-depth analysis detailing your home's value as well as a comparison with similar homes in the area
Home Values in the Area
Average Home Value in this Area
Purchase History
| Date | Buyer | Sale Price | Title Company |
|---|---|---|---|
| Ch Forever Llc | $2,435,000 | -- | |
| J49 Avenue Llc | $1,433,000 | -- | |
| Salerni Robert | -- | -- |
Source: Public Records
Mortgage History
| Date | Status | Borrower | Loan Amount |
|---|---|---|---|
| Open | Ch Forever Llc | $1,020,228 | |
| Previous Owner | J49 Avenue Llc | $845,000 | |
| Previous Owner | Salerni Robert | $150,000 |
Source: Public Records
Tax History Compared to Growth
Tax History
| Year | Tax Paid | Tax Assessment Tax Assessment Total Assessment is a certain percentage of the fair market value that is determined by local assessors to be the total taxable value of land and additions on the property. | Land | Improvement |
|---|---|---|---|---|
| 2025 | $26,684 | $253,350 | $76,320 | $177,030 |
| 2024 | $26,684 | $251,924 | $66,240 | $185,684 |
| 2023 | $27,227 | $257,054 | $56,160 | $200,894 |
| 2022 | $27,151 | $252,450 | $86,400 | $166,050 |
| 2021 | $21,992 | $205,650 | $36,000 | $169,650 |
| 2020 | $28,820 | $285,300 | $36,000 | $249,300 |
| 2019 | $28,083 | $290,700 | $36,000 | $254,700 |
| 2018 | $27,286 | $259,525 | $26,100 | $233,425 |
| 2017 | $15,860 | $150,847 | $23,400 | $127,447 |
| 2016 | $17,465 | $150,847 | $23,400 | $127,447 |
| 2015 | $11,581 | $156,443 | $22,500 | $133,943 |
| 2014 | $11,581 | $155,363 | $22,500 | $132,863 |
Source: Public Records
Map
Nearby Homes
- 10-64 Jackson Ave Unit 4-B
- 5-27 51st Ave Unit PH-B
- 206B Plan at Vesta
- 407B Plan at Vesta
- PH4A Plan at Vesta
- 405B Plan at Vesta
- 608B Plan at Vesta
- 207A Plan at Vesta
- 210B Plan at Vesta
- 311B Plan at Vesta
- 502A Plan at Vesta
- 204A Plan at Vesta
- 305B Plan at Vesta
- 301A Plan at Vesta
- 510B Plan at Vesta
- 404B Plan at Vesta
- 405A Plan at Vesta
- 309B Plan at Vesta
- 11-02 49th Ave Unit 8-A
- 11-02 49th Ave Unit PH-1C
- 1011 49th Ave Unit 5F
- 10-11 49th Ave Unit 8N
- 10-11 49th Ave Unit PH2L
- 10-11 49th Ave Unit 3
- 10-11 49th Ave
- 10-11 49th Ave Unit 4B
- 1009 49th Ave
- 4819 Vernon Blvd
- 1015 49th Ave
- 4817 Vernon Blvd
- 4813 Vernon Blvd
- 48-15 Vernon Blvd Unit 2
- 48-15 Vernon Blvd Unit 1
- 4811 Vernon Blvd
- 48-13 Vernon Blvd Unit 3
- 48-13 Vernon Blvd Unit 2
- 4815 Vernon Blvd
- 48-13 Vernon Blvd Unit 2-FLR
- 48-19 Vernon Blvd Unit PH
- 48-19 Vernon Blvd Unit 2A