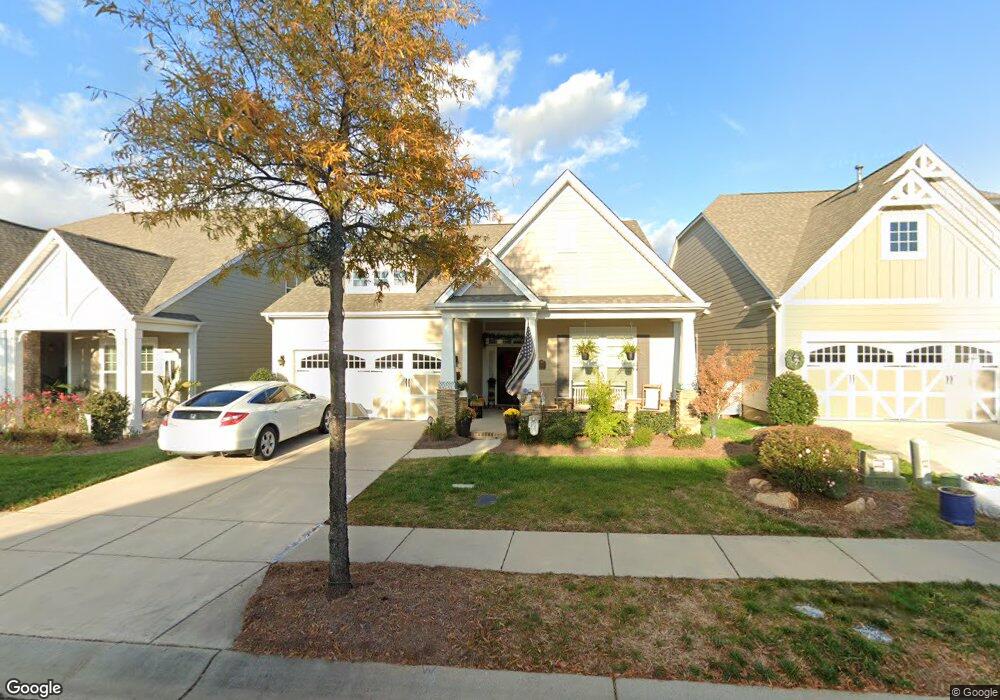
1011 Binelech Dr Indian Trail, NC 28079
Estimated Value: $406,728 - $464,000
3
Beds
2
Baths
1,854
Sq Ft
$235/Sq Ft
Est. Value
About This Home
This home is located at 1011 Binelech Dr, Indian Trail, NC 28079 and is currently estimated at $436,432, approximately $235 per square foot. 1011 Binelech Dr is a home located in Union County with nearby schools including Poplin Elementary School, Porter Ridge Middle School, and Porter Ridge High School.
Ownership History
Date
Name
Owned For
Owner Type
Purchase Details
Closed on
Dec 5, 2017
Sold by
Potter Gary E and Potter Elaine E
Bought by
Rivera Jose R and Rivera Sherly R
Current Estimated Value
Purchase Details
Closed on
Aug 4, 2016
Sold by
Green Donna P
Bought by
Potter Gary E and Potter Elaine E
Home Financials for this Owner
Home Financials are based on the most recent Mortgage that was taken out on this home.
Original Mortgage
$165,000
Interest Rate
3.56%
Mortgage Type
New Conventional
Purchase Details
Closed on
Jan 30, 2014
Sold by
Bonterra Builders Llc
Bought by
Green Donna Page
Home Financials for this Owner
Home Financials are based on the most recent Mortgage that was taken out on this home.
Original Mortgage
$70,000
Interest Rate
4.48%
Mortgage Type
New Conventional
Purchase Details
Closed on
Oct 18, 2013
Sold by
Poplin Development Group Inc
Bought by
Bonterra Builders Llc
Home Financials for this Owner
Home Financials are based on the most recent Mortgage that was taken out on this home.
Original Mortgage
$40,707
Interest Rate
4.52%
Mortgage Type
Construction
Create a Home Valuation Report for This Property
The Home Valuation Report is an in-depth analysis detailing your home's value as well as a comparison with similar homes in the area
Home Values in the Area
Average Home Value in this Area
Purchase History
| Date | Buyer | Sale Price | Title Company |
|---|---|---|---|
| Rivera Jose R | $250,000 | None Available | |
| Potter Gary E | $220,000 | None Available | |
| Green Donna Page | $217,000 | None Available | |
| Bonterra Builders Llc | $240,000 | None Available |
Source: Public Records
Mortgage History
| Date | Status | Borrower | Loan Amount |
|---|---|---|---|
| Previous Owner | Potter Gary E | $165,000 | |
| Previous Owner | Green Donna Page | $70,000 | |
| Previous Owner | Bonterra Builders Llc | $40,707 |
Source: Public Records
Tax History Compared to Growth
Tax History
| Year | Tax Paid | Tax Assessment Tax Assessment Total Assessment is a certain percentage of the fair market value that is determined by local assessors to be the total taxable value of land and additions on the property. | Land | Improvement |
|---|---|---|---|---|
| 2024 | $2,366 | $279,300 | $53,000 | $226,300 |
| 2023 | $2,346 | $279,300 | $53,000 | $226,300 |
| 2022 | $2,346 | $279,300 | $53,000 | $226,300 |
| 2021 | $2,346 | $279,300 | $53,000 | $226,300 |
| 2020 | $1,629 | $208,900 | $40,000 | $168,900 |
| 2019 | $2,079 | $208,900 | $40,000 | $168,900 |
| 2018 | $1,629 | $208,900 | $40,000 | $168,900 |
| 2017 | $2,187 | $208,900 | $40,000 | $168,900 |
| 2016 | $2,140 | $208,900 | $40,000 | $168,900 |
| 2015 | $1,729 | $208,900 | $40,000 | $168,900 |
| 2014 | $300 | $198,360 | $42,000 | $156,360 |
Source: Public Records
Map
Nearby Homes
- 1018 Equipoise Dr
- 1305 Belmont Stakes Ave
- 0 Saratoga Blvd
- 1021 Hercules Dr
- 1002 Phar Lap Dr
- 1011 Phar Lap Dr
- 272 Briana Marie Way
- 261 Briana Marie Way
- 1515 Saratoga Blvd
- 269 Briana Marie Way
- 280 Portrait Way
- 267 Portrait Way
- 149 Briana Marie Way
- 211 Aldendale Dr
- 405 Northgate Blvd
- 4003 Ladys Secret Dr
- 1018 Back Stretch Blvd
- 1036 Preakness Blvd
- 523 Sunharvest Ln
- 507 Sunharvest Ln
- 1011 Bimelech Dr
- 1013 Binelech Dr
- 1013 Bimelech Dr
- 1009 Binelech Dr
- 1015 Bimelach Dr
- 1007 Binelech Dr
- 1010 Bimelach Dr
- 1010 Equipose Dr
- 1012 Equipose Dr
- 1008 Bimelach Dr
- 1012 Bimelach Dr
- 1008 Equipoise Dr Unit 637
- 1008 Equipose Dr
- 1008 Equipoise Dr
- 1017 Bimelech Dr
- 1005 Bimelach Dr
- 1012 Bimelech Dr
- 1014 Equipoise Dr
- 1014 Equipose Dr
- 1006 Bimelech Dr