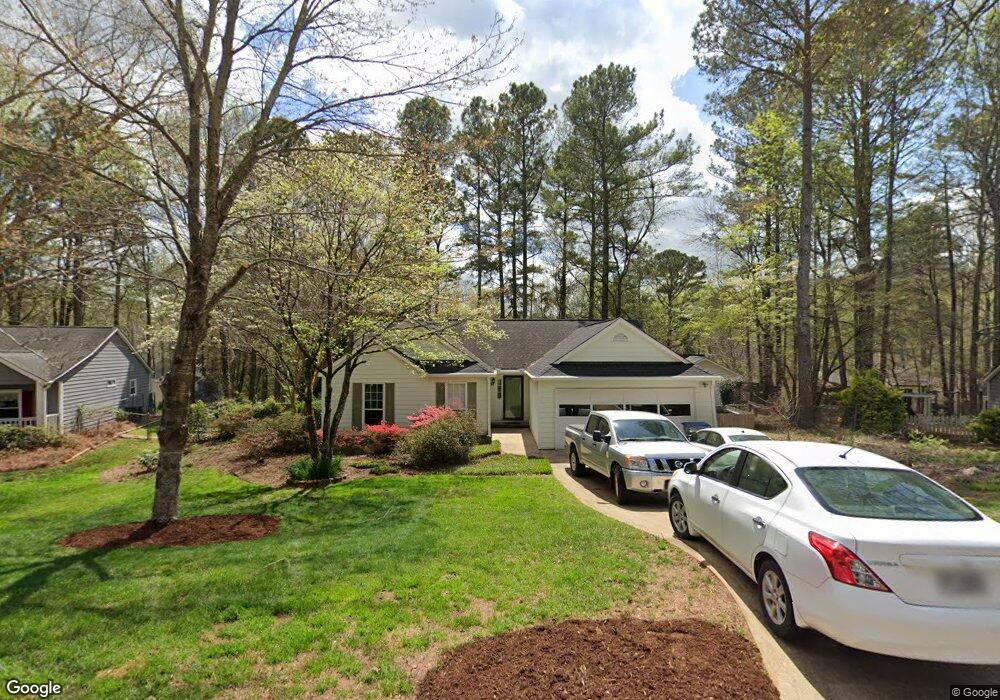
1011 Braddock Cir Unit 2 Woodstock, GA 30189
Oak Grove NeighborhoodEstimated Value: $352,000
3
Beds
2
Baths
1,620
Sq Ft
$217/Sq Ft
Est. Value
About This Home
This home is located at 1011 Braddock Cir Unit 2, Woodstock, GA 30189 and is currently estimated at $352,000, approximately $217 per square foot. 1011 Braddock Cir Unit 2 is a home located in Cherokee County with nearby schools including Boston Elementary School, E. T. Booth Middle School, and Etowah High School.
Ownership History
Date
Name
Owned For
Owner Type
Purchase Details
Closed on
Jan 27, 2025
Sold by
Hardy Tim S
Bought by
Hardy Timothy Steven Tr
Current Estimated Value
Purchase Details
Closed on
Oct 13, 1995
Sold by
Reece Charles
Bought by
Hardy Tim Anita
Purchase Details
Closed on
Jun 24, 1994
Sold by
Bigelow Robert and Bigelow Jo Ann
Bought by
Reece Charles O
Home Financials for this Owner
Home Financials are based on the most recent Mortgage that was taken out on this home.
Original Mortgage
$87,200
Interest Rate
8.52%
Create a Home Valuation Report for This Property
The Home Valuation Report is an in-depth analysis detailing your home's value as well as a comparison with similar homes in the area
Home Values in the Area
Average Home Value in this Area
Purchase History
| Date | Buyer | Sale Price | Title Company |
|---|---|---|---|
| Hardy Timothy Steven Tr | -- | -- | |
| Hardy Tim Anita | $7,000 | -- | |
| Reece Charles O | $88,500 | -- |
Source: Public Records
Mortgage History
| Date | Status | Borrower | Loan Amount |
|---|---|---|---|
| Previous Owner | Reece Charles O | $87,200 |
Source: Public Records
Tax History Compared to Growth
Tax History
| Year | Tax Paid | Tax Assessment Tax Assessment Total Assessment is a certain percentage of the fair market value that is determined by local assessors to be the total taxable value of land and additions on the property. | Land | Improvement |
|---|---|---|---|---|
| 2025 | $598 | $141,608 | $28,000 | $113,608 |
| 2024 | $568 | $126,248 | $24,000 | $102,248 |
| 2023 | $461 | $136,768 | $24,000 | $112,768 |
| 2022 | $542 | $108,568 | $22,000 | $86,568 |
| 2021 | $508 | $85,924 | $14,000 | $71,924 |
| 2020 | $481 | $78,116 | $14,000 | $64,116 |
| 2019 | $454 | $71,080 | $14,000 | $57,080 |
| 2018 | $440 | $65,560 | $12,800 | $52,760 |
| 2017 | $430 | $150,100 | $12,800 | $47,240 |
| 2016 | $425 | $138,100 | $11,600 | $43,640 |
| 2015 | $415 | $123,400 | $10,040 | $39,320 |
| 2014 | $401 | $113,900 | $10,040 | $35,520 |
Source: Public Records
Map
Nearby Homes
- 210 Brolley Woods Dr Unit 1
- 302 Victory Commons Overlook
- 1121 Britley Park Ln
- 1085 Britley Park Ln
- 1092 Britley Park Ln
- 222 Gallant Fox Way
- 6387 Bells Ferry Rd
- 211 Chelsea Ct
- 204 Chelsea Ct Unit 2
- 2038 Britley Park Crossing
- 6400 Bells Ferry Rd
- 1216 Marlo Way
- Sanctuary Plan at Maple Grove at Towne Lake
- Stillhouse Plan at Maple Grove at Towne Lake
- Ridgeford Plan at Maple Grove at Towne Lake
- Copperdale Plan at Maple Grove at Towne Lake
- Octavia Plan at Maple Grove at Towne Lake
- Cartwright II Plan at Maple Grove at Towne Lake
- 1009 Braddock Cir
- 1013 Braddock Cir
- 420 Rockingham Ln
- 418 Rockingham Ln
- 1007 Braddock Cir
- 416 Rockingham Ln
- 422 Rockingham Ln
- 1010 Braddock Cir
- 1015 Braddock Cir
- 414 Rockingham Ln Unit 2
- 1008 Braddock Cir
- 424 Rockingham Ln
- 1012 Braddock Cir Unit 2
- 804 Braddock Place Unit 2
- 412 Rockingham Ln
- 419 Rockingham Ln
- 421 Rockingham Ln Unit 2
- 0 Rockingham Ln Unit 8786956
- 0 Rockingham Ln Unit 7021444
- 0 Rockingham Ln Unit 7127053