Estimated Value: $93,000 - $155,000
4
Beds
2
Baths
2,324
Sq Ft
$56/Sq Ft
Est. Value
About This Home
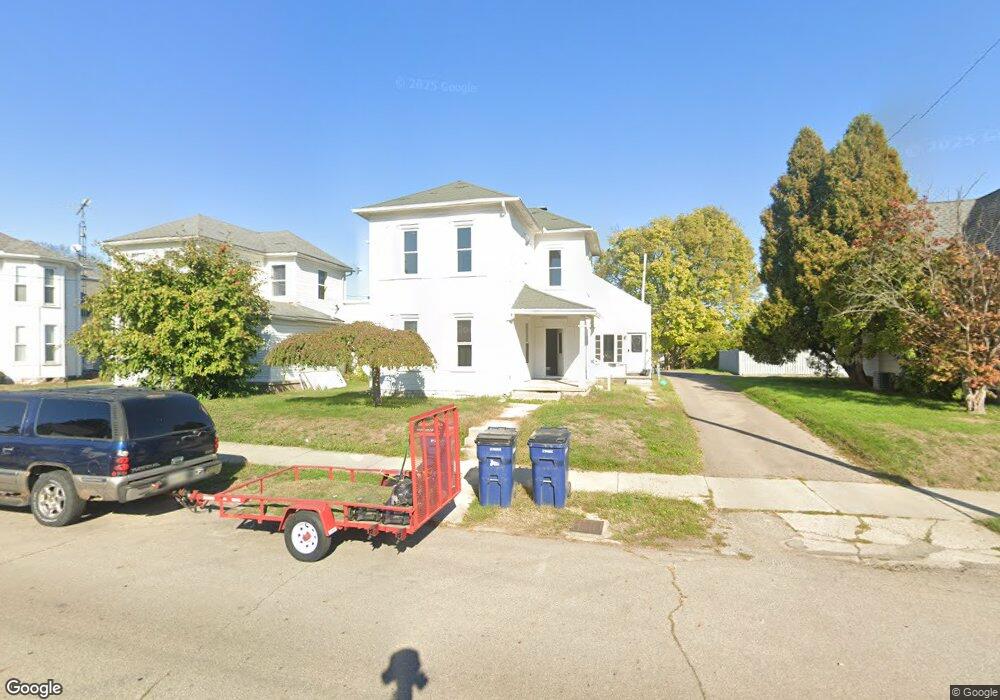
This home is located at 1011 Broadway, Piqua, OH 45356 and is currently estimated at $131,056, approximately $56 per square foot. 1011 Broadway is a home located in Miami County with nearby schools including Piqua Central Intermediate School, Springcreek Primary School, and Piqua Junior High School.
Ownership History
Date
Name
Owned For
Owner Type
Purchase Details
Closed on
Jun 5, 2018
Sold by
Haines Michael D and Haines Jilly Mae R
Bought by
Haines Michael D and Haines Jilly Mae R
Current Estimated Value
Purchase Details
Closed on
Feb 20, 2014
Sold by
Haines Paul A and Haines Linda L
Bought by
Haines Michael D
Purchase Details
Closed on
Feb 14, 2013
Sold by
Young Jeffrey S
Bought by
Us Bank National Association
Purchase Details
Closed on
Jan 30, 2013
Sold by
Young Jeffrey S
Bought by
Us Bank National Association
Purchase Details
Closed on
Mar 27, 2007
Sold by
Werling Frederick J
Bought by
Young Jeffrey S
Home Financials for this Owner
Home Financials are based on the most recent Mortgage that was taken out on this home.
Original Mortgage
$61,750
Interest Rate
6.27%
Mortgage Type
New Conventional
Purchase Details
Closed on
Jan 1, 1990
Bought by
Werling Frederick U
Create a Home Valuation Report for This Property
The Home Valuation Report is an in-depth analysis detailing your home's value as well as a comparison with similar homes in the area
Home Values in the Area
Average Home Value in this Area
Purchase History
| Date | Buyer | Sale Price | Title Company |
|---|---|---|---|
| Haines Michael D | -- | None Available | |
| Haines Michael D | -- | Evans Title Agency Inc | |
| Us Bank National Association | $32,000 | None Available | |
| Us Bank National Association | $32,000 | None Available | |
| Young Jeffrey S | $65,000 | -- | |
| Werling Frederick U | -- | -- |
Source: Public Records
Mortgage History
| Date | Status | Borrower | Loan Amount |
|---|---|---|---|
| Previous Owner | Young Jeffrey S | $61,750 |
Source: Public Records
Tax History Compared to Growth
Tax History
| Year | Tax Paid | Tax Assessment Tax Assessment Total Assessment is a certain percentage of the fair market value that is determined by local assessors to be the total taxable value of land and additions on the property. | Land | Improvement |
|---|---|---|---|---|
| 2024 | $1,296 | $30,730 | $8,750 | $21,980 |
| 2023 | $1,296 | $30,730 | $8,750 | $21,980 |
| 2022 | $1,318 | $30,730 | $8,750 | $21,980 |
| 2021 | $1,105 | $23,630 | $6,720 | $16,910 |
| 2020 | $1,086 | $23,630 | $6,720 | $16,910 |
| 2019 | $1,092 | $23,630 | $6,720 | $16,910 |
| 2018 | $913 | $18,830 | $7,000 | $11,830 |
| 2017 | $924 | $18,830 | $7,000 | $11,830 |
| 2016 | $915 | $18,830 | $7,000 | $11,830 |
| 2015 | $887 | $18,100 | $6,720 | $11,380 |
| 2014 | $887 | $18,100 | $6,720 | $11,380 |
| 2013 | $890 | $18,100 | $6,720 | $11,380 |
Source: Public Records
Map
Nearby Homes