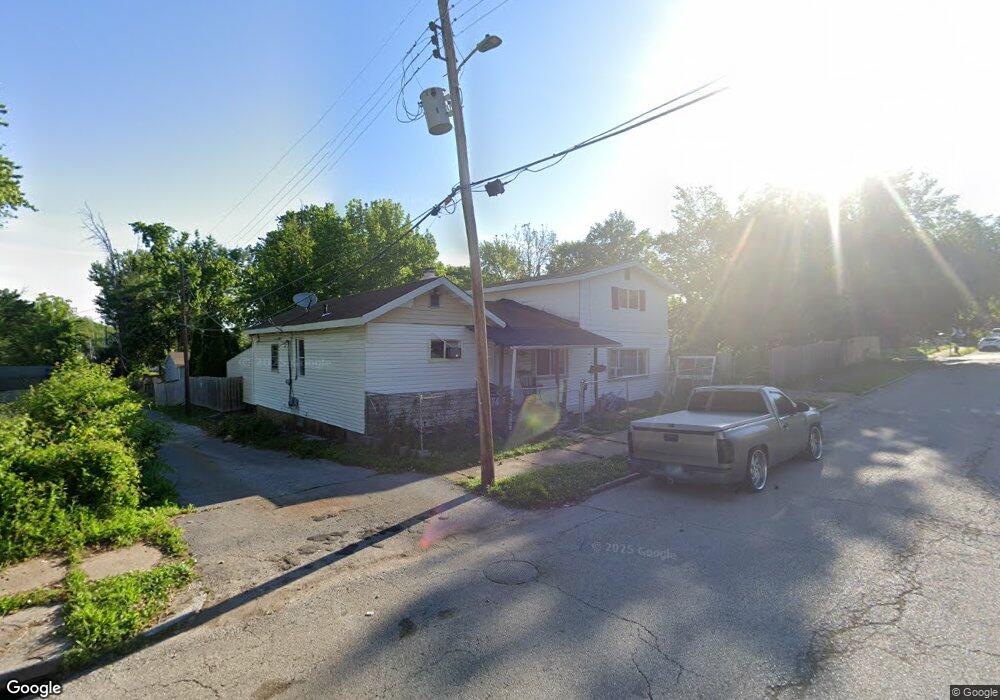
1011 Canaan Ave Saint Louis, MO 63147
Baden NeighborhoodEstimated Value: $55,000 - $87,000
--
Bed
1
Bath
1,728
Sq Ft
$44/Sq Ft
Est. Value
About This Home
This home is located at 1011 Canaan Ave, Saint Louis, MO 63147 and is currently estimated at $76,251, approximately $44 per square foot. 1011 Canaan Ave is a home located in St. Louis City with nearby schools including Earl Nance Sr. Elementary School, Yeatman-Liddell Middle School, and Vashon High School.
Ownership History
Date
Name
Owned For
Owner Type
Purchase Details
Closed on
Sep 21, 2021
Sold by
Land Reutilization Authority Of City Of
Bought by
Davis Kenneth W
Current Estimated Value
Purchase Details
Closed on
Aug 24, 2020
Sold by
Kgn Investments Llc
Bought by
Mejia Idalia
Purchase Details
Closed on
Aug 17, 2020
Sold by
Kgn Investments Llc
Bought by
Mejia Idalia
Purchase Details
Closed on
Dec 4, 2007
Sold by
Hud
Bought by
Kgn Investments Llc
Purchase Details
Closed on
Feb 8, 2007
Sold by
Washington Mutual Bank
Bought by
Hud
Purchase Details
Closed on
Jul 24, 2006
Sold by
Wellmaker Calvin
Bought by
Washington Mutual Bank and Washington Mutual Bank Fa
Purchase Details
Closed on
Jun 1, 2000
Sold by
Wellmaker Calvin
Bought by
Wellmaker Calvin
Purchase Details
Closed on
May 14, 1999
Sold by
Calvin Wellmaker
Bought by
Wellmaker Calvin and Wellmaker Shauntel
Create a Home Valuation Report for This Property
The Home Valuation Report is an in-depth analysis detailing your home's value as well as a comparison with similar homes in the area
Home Values in the Area
Average Home Value in this Area
Purchase History
| Date | Buyer | Sale Price | Title Company |
|---|---|---|---|
| Davis Kenneth W | -- | None Available | |
| Mejia Idalia | -- | Investors Title | |
| Mejia Idalia | -- | Investors Title | |
| Mejia Idalia | $6,500 | Investors Title Company | |
| Kgn Investments Llc | -- | Fa | |
| Hud | -- | None Available | |
| Washington Mutual Bank | $46,379 | None Available | |
| Wellmaker Calvin | -- | -- | |
| Wellmaker Calvin | -- | -- |
Source: Public Records
Tax History Compared to Growth
Tax History
| Year | Tax Paid | Tax Assessment Tax Assessment Total Assessment is a certain percentage of the fair market value that is determined by local assessors to be the total taxable value of land and additions on the property. | Land | Improvement |
|---|---|---|---|---|
| 2025 | $380 | $4,340 | $820 | $3,520 |
| 2024 | $362 | $4,200 | $820 | $3,380 |
| 2023 | $362 | $4,200 | $820 | $3,380 |
| 2022 | $370 | $4,140 | $820 | $3,320 |
| 2021 | $370 | $4,140 | $820 | $3,320 |
| 2020 | $375 | $4,240 | $820 | $3,420 |
| 2019 | $374 | $4,240 | $820 | $3,420 |
| 2018 | $377 | $4,150 | $820 | $3,330 |
| 2017 | $371 | $4,140 | $820 | $3,330 |
| 2016 | $497 | $5,590 | $1,670 | $3,910 |
| 2015 | $452 | $5,580 | $1,670 | $3,910 |
| 2014 | $450 | $5,580 | $1,670 | $3,910 |
| 2013 | -- | $5,570 | $1,670 | $3,900 |
Source: Public Records
Map
Nearby Homes
- 8954 Edna St
- 963 Canaan Ave
- 949 Canaan Ave
- 8937 Edna St
- 1029 Wall St
- 948 Harlan Ave
- 887 Wall St
- 1047 Veronica Ave
- 905 Hornsby Ave
- 854 Canaan Ave
- 853 Nassau Dr
- 1022 Theobald St
- 820 Elias Ave
- 8612 Halls Ferry Rd
- 8828 Riverview Blvd
- 8786 Jordan Ave
- 8459 Newby St
- 8447 Concord Place
- 1116 McLaran Ave
- 9219 Sundown Dr