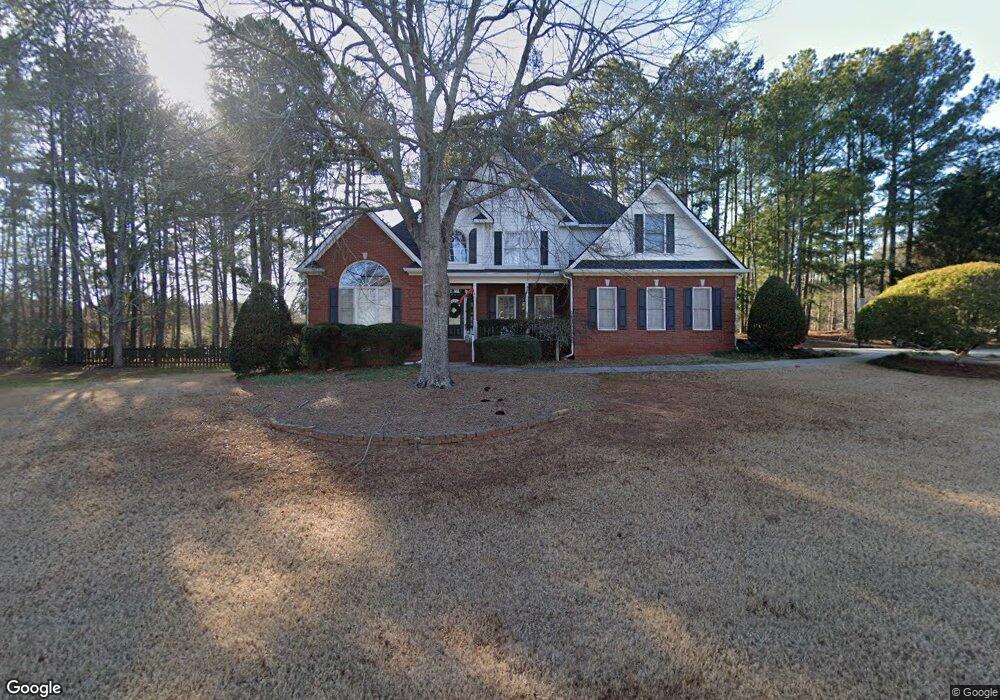
1011 Chris Ct Athens, GA 30606
Estimated Value: $600,777 - $768,000
5
Beds
4
Baths
3,245
Sq Ft
$219/Sq Ft
Est. Value
About This Home
This home is located at 1011 Chris Ct, Athens, GA 30606 and is currently estimated at $711,944, approximately $219 per square foot. 1011 Chris Ct is a home located in Oconee County with nearby schools including Oconee County Elementary School, Oconee County Primary School, and Oconee County Middle School.
Ownership History
Date
Name
Owned For
Owner Type
Purchase Details
Closed on
Jan 18, 2006
Sold by
Not Provided
Bought by
Lewis Anthony W and Lewis Megan O
Current Estimated Value
Home Financials for this Owner
Home Financials are based on the most recent Mortgage that was taken out on this home.
Original Mortgage
$256,000
Outstanding Balance
$143,380
Interest Rate
6.21%
Mortgage Type
New Conventional
Estimated Equity
$568,564
Purchase Details
Closed on
Aug 4, 2004
Sold by
Hobbs Phillip Thomas and Hobbs Dorothy S
Bought by
Schaefer David
Purchase Details
Closed on
Nov 10, 1997
Sold by
Lyle Derrick S
Bought by
Hobbs Phillip Thoma
Purchase Details
Closed on
Mar 21, 1997
Sold by
Sts Developers Inc
Bought by
Lyle Derrick S
Create a Home Valuation Report for This Property
The Home Valuation Report is an in-depth analysis detailing your home's value as well as a comparison with similar homes in the area
Home Values in the Area
Average Home Value in this Area
Purchase History
| Date | Buyer | Sale Price | Title Company |
|---|---|---|---|
| Lewis Anthony W | -- | -- | |
| Lewis Anthony W | $320,000 | -- | |
| Schaefer David | $316,600 | -- | |
| Hobbs Phillip Thoma | $279,000 | -- | |
| Lyle Derrick S | $31,500 | -- |
Source: Public Records
Mortgage History
| Date | Status | Borrower | Loan Amount |
|---|---|---|---|
| Open | Lewis Anthony W | $256,000 | |
| Closed | Lewis Anthony W | $256,000 |
Source: Public Records
Tax History Compared to Growth
Tax History
| Year | Tax Paid | Tax Assessment Tax Assessment Total Assessment is a certain percentage of the fair market value that is determined by local assessors to be the total taxable value of land and additions on the property. | Land | Improvement |
|---|---|---|---|---|
| 2024 | $3,855 | $205,100 | $30,000 | $175,100 |
| 2023 | $3,831 | $189,842 | $26,000 | $163,842 |
| 2022 | $3,539 | $165,301 | $26,000 | $139,301 |
| 2021 | $3,330 | $144,286 | $24,000 | $120,286 |
| 2020 | $3,308 | $143,132 | $24,000 | $119,132 |
| 2019 | $3,100 | $134,140 | $24,000 | $110,140 |
| 2018 | $2,952 | $125,114 | $24,000 | $101,114 |
| 2017 | $2,929 | $124,124 | $24,000 | $100,124 |
| 2016 | $2,907 | $123,209 | $24,000 | $99,209 |
| 2015 | $2,915 | $123,296 | $24,000 | $99,296 |
| 2014 | $2,874 | $118,848 | $24,000 | $94,848 |
| 2013 | -- | $114,927 | $24,000 | $90,927 |
Source: Public Records
Map
Nearby Homes
- 1010 Springview Ct
- 1050 Chestnut Glen
- 1621 Daniells Bridge Rd
- 1340 Old Epps Bridge Rd
- 1011 Magnolia Dr
- 1231 Founders Lake Dr
- 2481 Lakewood Manor Dr
- 1271 Daniells Bridge Rd
- 1080 Barber Creek Dr
- 1091 Barber Creek Dr
- 1051 Riverhaven Ln
- 1020 Barber Creek Dr Unit 211
- 3065 Meadow Springs Dr
- 165 Canterbury Dr
- 160 Edgewood Dr
- 1220 Twelve Oaks Cir
- 215 Lenox Rd