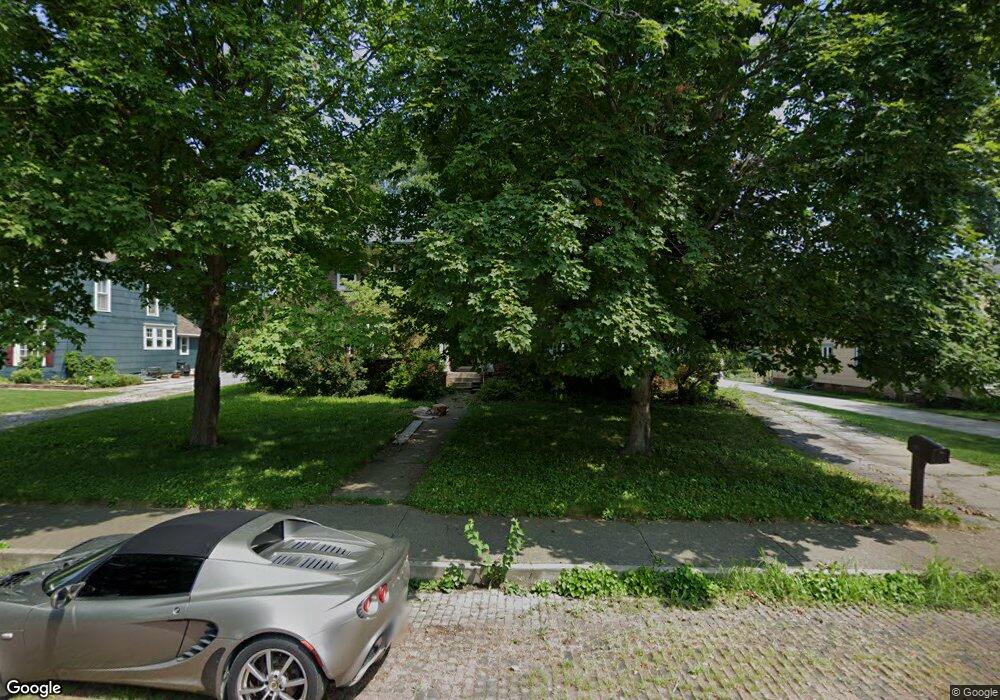
1011 E 5th St Fowler, IN 47944
Estimated Value: $279,000 - $378,000
5
Beds
3
Baths
3,184
Sq Ft
$98/Sq Ft
Est. Value
About This Home
This home is located at 1011 E 5th St, Fowler, IN 47944 and is currently estimated at $311,646, approximately $97 per square foot. 1011 E 5th St is a home located in Benton County with nearby schools including Benton Central Junior/Senior High School and Sacred Heart Elementary School.
Ownership History
Date
Name
Owned For
Owner Type
Purchase Details
Closed on
Jun 4, 2009
Sold by
Dehaven Jeremy and Dehaven Shannon
Bought by
Morales Carlos R and Morales Laura
Current Estimated Value
Home Financials for this Owner
Home Financials are based on the most recent Mortgage that was taken out on this home.
Original Mortgage
$174,775
Outstanding Balance
$108,511
Interest Rate
4.85%
Estimated Equity
$203,135
Create a Home Valuation Report for This Property
The Home Valuation Report is an in-depth analysis detailing your home's value as well as a comparison with similar homes in the area
Purchase History
| Date | Buyer | Sale Price | Title Company |
|---|---|---|---|
| Morales Carlos R | $178,000 | Benton Co Abstract & Title |
Source: Public Records
Mortgage History
| Date | Status | Borrower | Loan Amount |
|---|---|---|---|
| Open | Morales Carlos R | $174,775 |
Source: Public Records
Tax History
| Year | Tax Paid | Tax Assessment Tax Assessment Total Assessment is a certain percentage of the fair market value that is determined by local assessors to be the total taxable value of land and additions on the property. | Land | Improvement |
|---|---|---|---|---|
| 2025 | $3,698 | $310,900 | $14,200 | $296,700 |
| 2024 | $3,698 | $322,600 | $14,200 | $308,400 |
| 2023 | $3,308 | $287,100 | $15,100 | $272,000 |
| 2022 | $2,540 | $220,500 | $15,100 | $205,400 |
| 2021 | $2,050 | $179,700 | $15,100 | $164,600 |
| 2020 | $1,821 | $171,200 | $15,100 | $156,100 |
| 2019 | $1,678 | $169,100 | $15,100 | $154,000 |
| 2018 | $1,448 | $148,900 | $15,100 | $133,800 |
| 2017 | $1,480 | $145,800 | $15,100 | $130,700 |
| 2016 | $1,346 | $132,600 | $15,100 | $117,500 |
| 2014 | $1,203 | $118,500 | $14,600 | $103,900 |
| 2013 | $1,203 | $111,400 | $13,700 | $97,700 |
Source: Public Records
Map
Nearby Homes
Your Personal Tour Guide
Ask me questions while you tour the home.