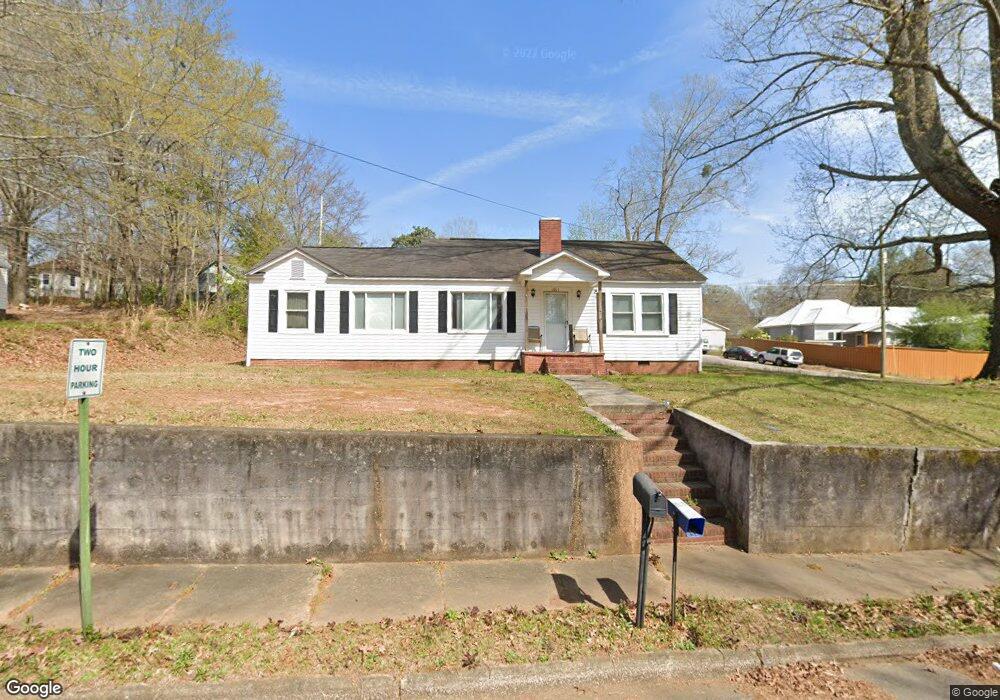
1011 Elm St Lagrange, GA 30240
Estimated Value: $65,000 - $218,000
3
Beds
1
Bath
1,452
Sq Ft
$94/Sq Ft
Est. Value
About This Home
This home is located at 1011 Elm St, Lagrange, GA 30240 and is currently estimated at $136,037, approximately $93 per square foot. 1011 Elm St is a home located in Troup County with nearby schools including Berta Weathersbee Elementary School, Whitesville Road Elementary School, and Rosemont Elementary School.
Ownership History
Date
Name
Owned For
Owner Type
Purchase Details
Closed on
Sep 5, 2017
Sold by
Pnc Bk National Assn
Bought by
Grego Audrey P
Current Estimated Value
Purchase Details
Closed on
May 2, 2017
Sold by
Parks Mattie Sue
Bought by
Pnc Bank National Association
Purchase Details
Closed on
Feb 23, 1999
Sold by
Robbie Chaffin Longshore and Robbie Exec
Bought by
Parks Mattie Sue
Purchase Details
Closed on
May 23, 1969
Sold by
Evans B A
Bought by
Robbie Chaffin Longshore and Robbie Exec
Create a Home Valuation Report for This Property
The Home Valuation Report is an in-depth analysis detailing your home's value as well as a comparison with similar homes in the area
Purchase History
| Date | Buyer | Sale Price | Title Company |
|---|---|---|---|
| Grego Audrey P | $30,013 | -- | |
| Pnc Bank National Association | $30,000 | -- | |
| Parks Mattie Sue | $47,000 | -- | |
| Robbie Chaffin Longshore | $8,000 | -- |
Source: Public Records
Tax History
| Year | Tax Paid | Tax Assessment Tax Assessment Total Assessment is a certain percentage of the fair market value that is determined by local assessors to be the total taxable value of land and additions on the property. | Land | Improvement |
|---|---|---|---|---|
| 2025 | $848 | $39,760 | $3,160 | $36,600 |
| 2024 | $848 | $31,080 | $3,160 | $27,920 |
| 2023 | $783 | $28,720 | $3,160 | $25,560 |
| 2022 | $765 | $27,400 | $3,160 | $24,240 |
| 2021 | $731 | $24,240 | $3,160 | $21,080 |
| 2020 | $731 | $24,240 | $3,160 | $21,080 |
| 2019 | $672 | $22,280 | $3,160 | $19,120 |
| 2018 | $362 | $22,280 | $3,160 | $19,120 |
| 2017 | $689 | $22,852 | $3,132 | $19,720 |
| 2016 | $369 | $22,188 | $3,132 | $19,056 |
| 2015 | $370 | $22,188 | $3,132 | $19,056 |
| 2014 | $384 | $22,684 | $3,132 | $19,552 |
| 2013 | -- | $23,959 | $3,132 | $20,827 |
Source: Public Records
Map
Nearby Homes
Your Personal Tour Guide
Ask me questions while you tour the home.