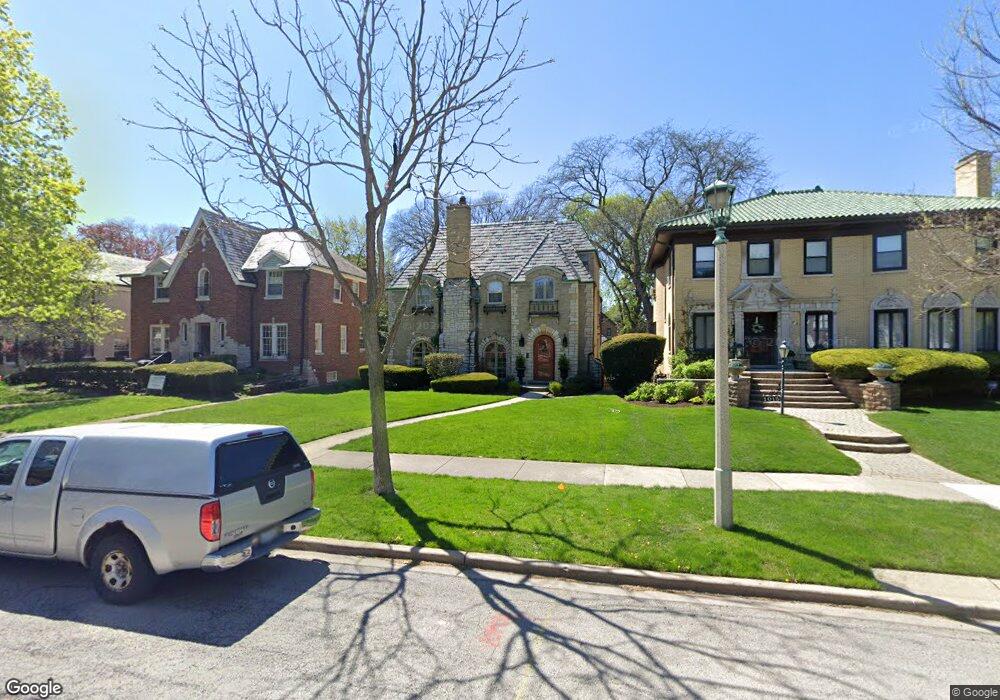
1011 Forest Ave Oak Park, IL 60302
Estimated Value: $854,000 - $933,000
4
Beds
3
Baths
2,194
Sq Ft
$406/Sq Ft
Est. Value
About This Home
This home is located at 1011 Forest Ave, Oak Park, IL 60302 and is currently estimated at $890,530, approximately $405 per square foot. 1011 Forest Ave is a home located in Cook County with nearby schools including Horace Mann Elementary School, Percy Julian Middle School, and Oak Park and River Forest High School.
Ownership History
Date
Name
Owned For
Owner Type
Purchase Details
Closed on
May 8, 2009
Sold by
Weindling David
Bought by
Mcnamra John L and Mc Namara Laura K
Current Estimated Value
Home Financials for this Owner
Home Financials are based on the most recent Mortgage that was taken out on this home.
Original Mortgage
$417,000
Outstanding Balance
$263,186
Interest Rate
4.83%
Mortgage Type
Unknown
Estimated Equity
$627,344
Purchase Details
Closed on
Jul 8, 2004
Sold by
Levitt Janet
Bought by
Weindling David
Purchase Details
Closed on
Aug 27, 1998
Sold by
Symington Mary T
Bought by
Weindling David and Levitt Janet
Home Financials for this Owner
Home Financials are based on the most recent Mortgage that was taken out on this home.
Original Mortgage
$150,000
Interest Rate
7.03%
Purchase Details
Closed on
Jun 17, 1998
Sold by
Symington Edward J and Symington Margaret A
Bought by
Symington Mary T
Create a Home Valuation Report for This Property
The Home Valuation Report is an in-depth analysis detailing your home's value as well as a comparison with similar homes in the area
Home Values in the Area
Average Home Value in this Area
Purchase History
| Date | Buyer | Sale Price | Title Company |
|---|---|---|---|
| Mcnamra John L | $622,500 | Chicago Title Insurance Co | |
| Weindling David | -- | -- | |
| Weindling David | $375,000 | -- | |
| Symington Mary T | -- | -- |
Source: Public Records
Mortgage History
| Date | Status | Borrower | Loan Amount |
|---|---|---|---|
| Open | Mcnamra John L | $417,000 | |
| Previous Owner | Weindling David | $150,000 |
Source: Public Records
Tax History Compared to Growth
Tax History
| Year | Tax Paid | Tax Assessment Tax Assessment Total Assessment is a certain percentage of the fair market value that is determined by local assessors to be the total taxable value of land and additions on the property. | Land | Improvement |
|---|---|---|---|---|
| 2024 | $21,348 | $68,802 | $12,658 | $56,144 |
| 2023 | $16,096 | $68,802 | $12,658 | $56,144 |
| 2022 | $16,096 | $45,339 | $10,998 | $34,341 |
| 2021 | $15,719 | $45,338 | $10,997 | $34,341 |
| 2020 | $15,418 | $45,338 | $10,997 | $34,341 |
| 2019 | $18,431 | $51,470 | $9,960 | $41,510 |
| 2018 | $17,738 | $51,470 | $9,960 | $41,510 |
| 2017 | $18,538 | $54,700 | $9,960 | $44,740 |
| 2016 | $20,308 | $52,954 | $8,300 | $44,654 |
| 2015 | $18,150 | $52,954 | $8,300 | $44,654 |
| 2014 | $16,884 | $52,954 | $8,300 | $44,654 |
| 2013 | $17,275 | $55,710 | $8,300 | $47,410 |
Source: Public Records
Map
Nearby Homes
- 1037 Belleforte Ave
- 1143 Woodbine Ave
- 1411 N Harlem Ave Unit A
- 1407 N Harlem Ave Unit C
- 810 N Marion St
- 1009 N Oak Park Ave
- 801 N Marion St
- 1130 N Grove Ave
- 827 N Grove Ave
- 742 N Marion St
- 1106 N Harlem Ave Unit 2
- 1129 Bonnie Brae Place Unit 1S
- 1600 N New England Ave Unit 4
- 820 N Oak Park Ave
- 925 Linden Ave
- 1000 N Harlem Ave
- 7234 W North Ave Unit 1214
- 7234 W North Ave Unit 1902
- 7234 W North Ave Unit 1701
- 7234 W North Ave Unit 1602
- 1015 Forest Ave
- 1007 Forest Ave
- 1019 Forest Ave
- 1001 Forest Ave
- 1021 Forest Ave
- 1006 Belleforte Ave
- 1014 Belleforte Ave
- 1027 Forest Ave
- 1000 Belleforte Ave
- 1016 Belleforte Ave
- 947 Forest Ave
- 1010 Forest Ave
- 1020 Belleforte Ave
- 1014 Forest Ave
- 1006 Forest Ave
- 1031 Forest Ave
- 1018 Forest Ave
- 1000 Forest Ave
- 943 Forest Ave
- 1024 Belleforte Ave