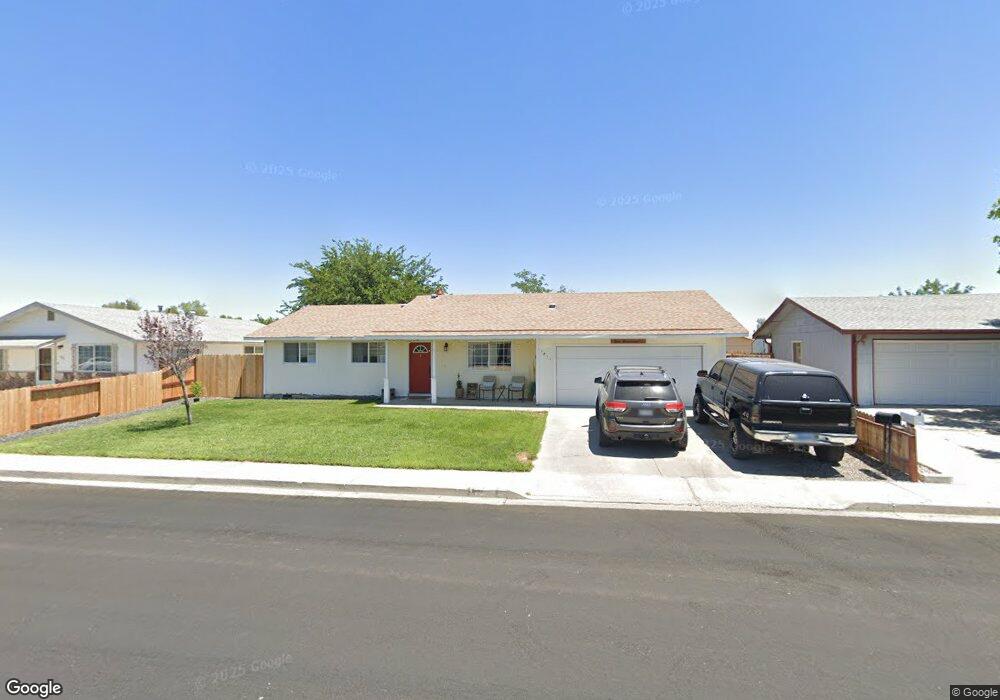
1011 James Ln Fallon, NV 89406
Estimated Value: $295,000 - $323,000
3
Beds
2
Baths
1,364
Sq Ft
$225/Sq Ft
Est. Value
About This Home
This home is located at 1011 James Ln, Fallon, NV 89406 and is currently estimated at $306,863, approximately $224 per square foot. 1011 James Ln is a home located in Churchill County with nearby schools including Lahontan Elementary School, E.C. Best Elementary School, and Numa Elementary School.
Ownership History
Date
Name
Owned For
Owner Type
Purchase Details
Closed on
Mar 24, 2009
Sold by
Federal National Mortgage Association
Bought by
Libby Ronald M and Libby May Joy P
Current Estimated Value
Home Financials for this Owner
Home Financials are based on the most recent Mortgage that was taken out on this home.
Original Mortgage
$65,250
Outstanding Balance
$41,578
Interest Rate
5.17%
Mortgage Type
Purchase Money Mortgage
Estimated Equity
$265,285
Purchase Details
Closed on
Oct 20, 2008
Sold by
Leon Manuel A
Bought by
Federal National Mortgage Association
Purchase Details
Closed on
Apr 2, 2005
Sold by
Leon Manuel A
Bought by
Leon Manuel A and Leon Frances L
Home Financials for this Owner
Home Financials are based on the most recent Mortgage that was taken out on this home.
Original Mortgage
$21,850
Interest Rate
5.77%
Create a Home Valuation Report for This Property
The Home Valuation Report is an in-depth analysis detailing your home's value as well as a comparison with similar homes in the area
Home Values in the Area
Average Home Value in this Area
Purchase History
| Date | Buyer | Sale Price | Title Company |
|---|---|---|---|
| Libby Ronald M | $87,000 | Lawyers Title Of Nevada | |
| Federal National Mortgage Association | $117,220 | Western Nevada Title Co | |
| Leon Manuel A | -- | Accommodation |
Source: Public Records
Mortgage History
| Date | Status | Borrower | Loan Amount |
|---|---|---|---|
| Open | Libby Ronald M | $65,250 | |
| Previous Owner | Leon Manuel A | $21,850 |
Source: Public Records
Tax History Compared to Growth
Tax History
| Year | Tax Paid | Tax Assessment Tax Assessment Total Assessment is a certain percentage of the fair market value that is determined by local assessors to be the total taxable value of land and additions on the property. | Land | Improvement |
|---|---|---|---|---|
| 2025 | $1,197 | $39,356 | $13,650 | $25,706 |
| 2024 | $1,197 | $39,440 | $12,950 | $26,490 |
| 2023 | $1,197 | $37,497 | $12,250 | $25,247 |
| 2022 | $1,056 | $28,629 | $8,050 | $20,579 |
| 2021 | $1,044 | $28,307 | $8,050 | $20,257 |
| 2020 | $1,041 | $29,105 | $8,050 | $21,055 |
| 2019 | $1,011 | $28,933 | $8,050 | $20,883 |
| 2018 | $982 | $28,716 | $8,050 | $20,666 |
| 2017 | $953 | $27,512 | $6,475 | $21,037 |
| 2016 | $929 | $25,955 | $6,475 | $19,480 |
| 2015 | $911 | $23,980 | $6,475 | $17,505 |
| 2014 | $883 | $23,266 | $7,000 | $16,266 |
Source: Public Records
Map
Nearby Homes
- 1021 Whitaker Ln
- 870 Sunset Dr
- 1049 Deena Way
- 620 Sunset Dr
- 1955 Manchester Cir
- 540 Anthony Ln
- 521 Whitaker Ln
- 575 Babb Place
- 435 Cindy Ln
- 445 S Allen St
- 485 S Russell St
- 360 & 360 1/2 W Virginia St
- 1091 Tiffany Dr
- 355 W Stillwater Ave
- 327 Burntwood St
- 250 S Taylor St
- 1.55 Acres on S Maine St
- 549 Lincoln St
- 627 S Maine St
- 468 S Maine St