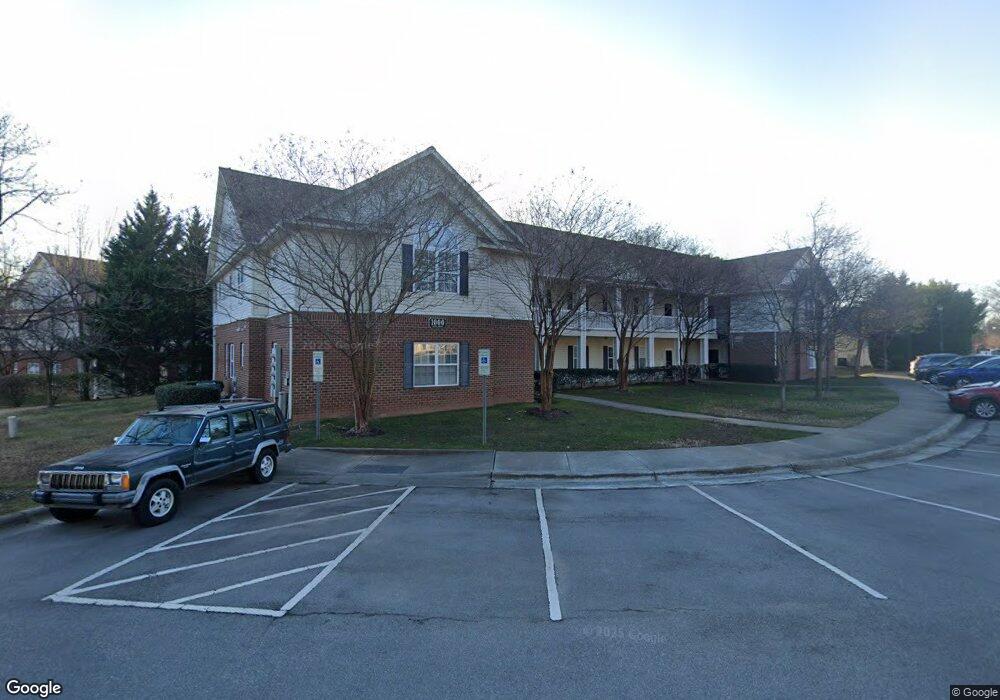
1011 Linen Dr Unit 1011 Morrisville, NC 27560
Estimated Value: $306,000 - $349,742
3
Beds
2
Baths
1,502
Sq Ft
$218/Sq Ft
Est. Value
About This Home
This home is located at 1011 Linen Dr Unit 1011, Morrisville, NC 27560 and is currently estimated at $327,186, approximately $217 per square foot. 1011 Linen Dr Unit 1011 is a home located in Wake County with nearby schools including Carpenter Elementary, Alston Ridge Middle School, and Green Hope High.
Ownership History
Date
Name
Owned For
Owner Type
Purchase Details
Closed on
Apr 21, 2019
Sold by
Patel Hitesh Chetan and Patel Chinkal Amrutlal
Bought by
Patel Hitendrakumar Rameshbhai and Patel Maya Hitendrakumar
Current Estimated Value
Purchase Details
Closed on
Mar 20, 2013
Sold by
Hanes Gregory J and Hanes Dawn L
Bought by
Patel Hitesh
Home Financials for this Owner
Home Financials are based on the most recent Mortgage that was taken out on this home.
Original Mortgage
$92,250
Interest Rate
3.56%
Mortgage Type
New Conventional
Purchase Details
Closed on
Sep 30, 2004
Sold by
Bill Clark Homes Of Raleigh Llc
Bought by
Hanes Gregory J
Home Financials for this Owner
Home Financials are based on the most recent Mortgage that was taken out on this home.
Original Mortgage
$130,940
Interest Rate
5.73%
Mortgage Type
FHA
Create a Home Valuation Report for This Property
The Home Valuation Report is an in-depth analysis detailing your home's value as well as a comparison with similar homes in the area
Home Values in the Area
Average Home Value in this Area
Purchase History
| Date | Buyer | Sale Price | Title Company |
|---|---|---|---|
| Patel Hitendrakumar Rameshbhai | $170,000 | None Available | |
| Patel Hitendrakumar Rameshbhai | $170,000 | None Listed On Document | |
| Patel Hitesh | $123,000 | None Available | |
| Hanes Gregory J | $135,000 | -- |
Source: Public Records
Mortgage History
| Date | Status | Borrower | Loan Amount |
|---|---|---|---|
| Previous Owner | Patel Hitesh | $92,250 | |
| Previous Owner | Hanes Gregory J | $130,940 |
Source: Public Records
Tax History Compared to Growth
Tax History
| Year | Tax Paid | Tax Assessment Tax Assessment Total Assessment is a certain percentage of the fair market value that is determined by local assessors to be the total taxable value of land and additions on the property. | Land | Improvement |
|---|---|---|---|---|
| 2025 | $3,090 | $317,468 | -- | $317,468 |
| 2024 | $3,079 | $317,468 | $0 | $317,468 |
| 2023 | $1,983 | $196,929 | $0 | $196,929 |
| 2022 | $1,919 | $196,929 | $0 | $196,929 |
| 2021 | $2,107 | $196,929 | $0 | $196,929 |
| 2020 | $2,107 | $196,929 | $0 | $196,929 |
| 2019 | $1,769 | $144,496 | $0 | $144,496 |
| 2018 | $1,674 | $144,496 | $0 | $144,496 |
| 2017 | $1,617 | $144,496 | $0 | $144,496 |
| 2016 | $1,596 | $144,496 | $0 | $144,496 |
| 2015 | $1,654 | $145,308 | $0 | $145,308 |
| 2014 | -- | $145,308 | $0 | $145,308 |
Source: Public Records
Map
Nearby Homes
- 313 Madres Ln
- 308 Madres Ln
- 103 Trumbell Cir
- 3322 Kudrow Ln Unit 3322
- 3113 Kudrow Ln Unit 3113
- 226 Leacroft Way
- 2923 Kudrow Ln Unit 2923
- 1329 Alemany St
- 1313 Alemany St
- 103 Millet Dr
- 234 Hampshire Downs Dr
- 309 Malvern Hill Ln
- 1511 Kudrow Ln Unit 1511B
- 207 Hampshire Downs Dr
- 222 Murray Glen Dr
- 605 Beech Hanger Dr
- 1058 Kingston Grove Dr
- 116 Plank Bridge Way
- 106 Honeycomb Ln
- 313 Plank Bridge Way
- 1024 Linen Dr Unit 1024
- 1023 Linen Dr Unit 1023
- 1022 Linen Dr Unit 1022
- 1014 Linen Dr Unit 1014
- 1013 Linen Dr Unit 1013
- 1021 Linen Dr
- 1012 Linen Dr Unit 1012
- 1124 Claret Ln Unit 1124
- 1122 Claret Ln
- 1114 Claret Ln
- 1112 Claret Ln Unit 1112
- 1111 Claret Ln
- 1113 Claret Ln Unit 1113
- 1111 Claret Ln
- 1111 Claret Ln
- 1100 Claret Ln
- 1111 Claret Ln
- 1111 Claret Ln
- 1111 Claret Ln
- 1111 Claret Ln