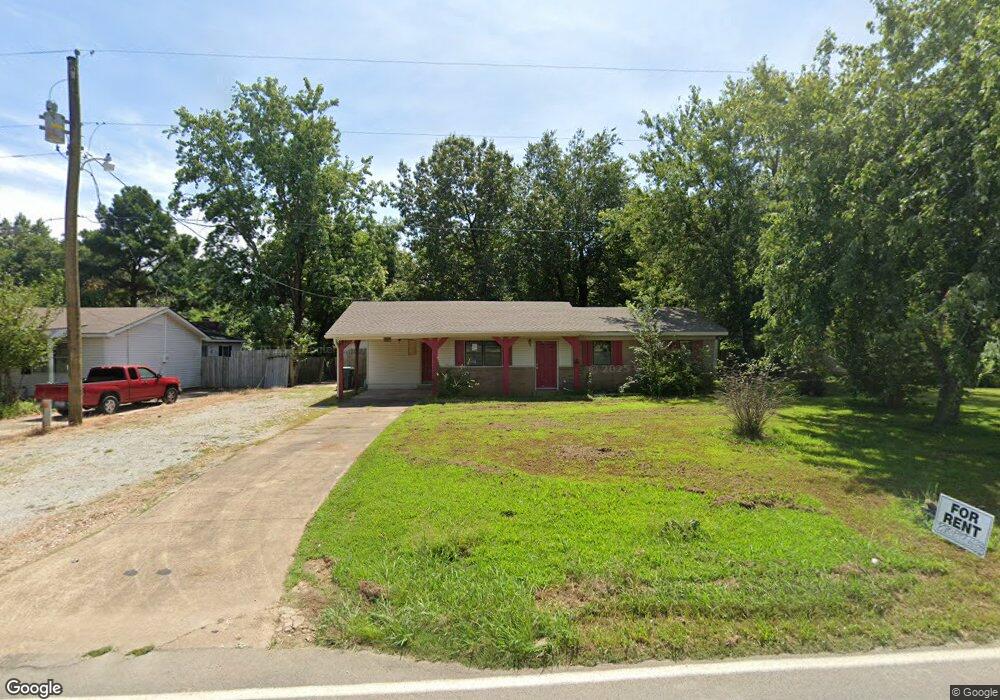
1011 Magnolia Rd Jonesboro, AR 72401
Estimated Value: $119,000 - $145,000
3
Beds
2
Baths
1,200
Sq Ft
$111/Sq Ft
Est. Value
About This Home
This home is located at 1011 Magnolia Rd, Jonesboro, AR 72401 and is currently estimated at $133,511, approximately $111 per square foot. 1011 Magnolia Rd is a home located in Craighead County with nearby schools including Douglas Macarthur Junior High School, The Academies at Jonesboro High School, and Montessori School of Jonesboro.
Ownership History
Date
Name
Owned For
Owner Type
Purchase Details
Closed on
Jun 24, 2019
Sold by
Wells Fargo Bank
Bought by
Lloyd Prop & Inv Llc
Current Estimated Value
Home Financials for this Owner
Home Financials are based on the most recent Mortgage that was taken out on this home.
Original Mortgage
$67,835
Interest Rate
3.82%
Mortgage Type
Commercial
Purchase Details
Closed on
May 22, 2019
Sold by
Whitmire Danny L and Whitmire Janet R
Bought by
Direct Mortgage Corporati On
Home Financials for this Owner
Home Financials are based on the most recent Mortgage that was taken out on this home.
Original Mortgage
$67,835
Interest Rate
3.82%
Mortgage Type
Commercial
Purchase Details
Closed on
Dec 19, 2000
Bought by
Whitmire
Create a Home Valuation Report for This Property
The Home Valuation Report is an in-depth analysis detailing your home's value as well as a comparison with similar homes in the area
Home Values in the Area
Average Home Value in this Area
Purchase History
| Date | Buyer | Sale Price | Title Company |
|---|---|---|---|
| Lloyd Prop & Inv Llc | $43,000 | Boston National Title | |
| Direct Mortgage Corporati On | -- | -- | |
| Whitmire | $72,000 | -- |
Source: Public Records
Mortgage History
| Date | Status | Borrower | Loan Amount |
|---|---|---|---|
| Closed | Lloyd Prop & Inv Llc | $67,835 | |
| Closed | Direct Mortgage Corporati On | -- |
Source: Public Records
Tax History Compared to Growth
Tax History
| Year | Tax Paid | Tax Assessment Tax Assessment Total Assessment is a certain percentage of the fair market value that is determined by local assessors to be the total taxable value of land and additions on the property. | Land | Improvement |
|---|---|---|---|---|
| 2025 | $779 | $21,088 | $2,500 | $18,588 |
| 2024 | $779 | $21,088 | $2,500 | $18,588 |
| 2023 | $702 | $21,088 | $2,500 | $18,588 |
| 2022 | $644 | $21,088 | $2,500 | $18,588 |
| 2021 | $600 | $14,210 | $1,400 | $12,810 |
| 2020 | $600 | $14,210 | $1,400 | $12,810 |
| 2019 | $110 | $14,210 | $1,400 | $12,810 |
| 2018 | $135 | $14,210 | $1,400 | $12,810 |
| 2017 | $135 | $14,210 | $1,400 | $12,810 |
| 2016 | $135 | $11,490 | $1,400 | $10,090 |
| 2015 | $135 | $11,490 | $1,400 | $10,090 |
| 2014 | $135 | $11,490 | $1,400 | $10,090 |
Source: Public Records
Map
Nearby Homes
- 1011 Magnolia Rd Unit 1115 Windover
- 1107 Magnolia Rd
- 1003 Magnolia Rd
- 2116 N Patrick St
- 2020 N Patrick St
- 2118 N Patrick St
- 1221 Magnolia Rd
- 2114 N Patrick St
- 911 Magnolia Rd
- 1225 Magnolia Rd
- 1004 Darlene Dr
- 1002 Darlene Dr
- 1227 Magnolia Rd
- 1006 Darlene Dr
- 2115 N Patrick St
- 2106 N Patrick St
- 1231 Magnolia Rd
- 902 Magnolia Rd
- 2111 Mitzi Ln
- 0 Darlene Dr