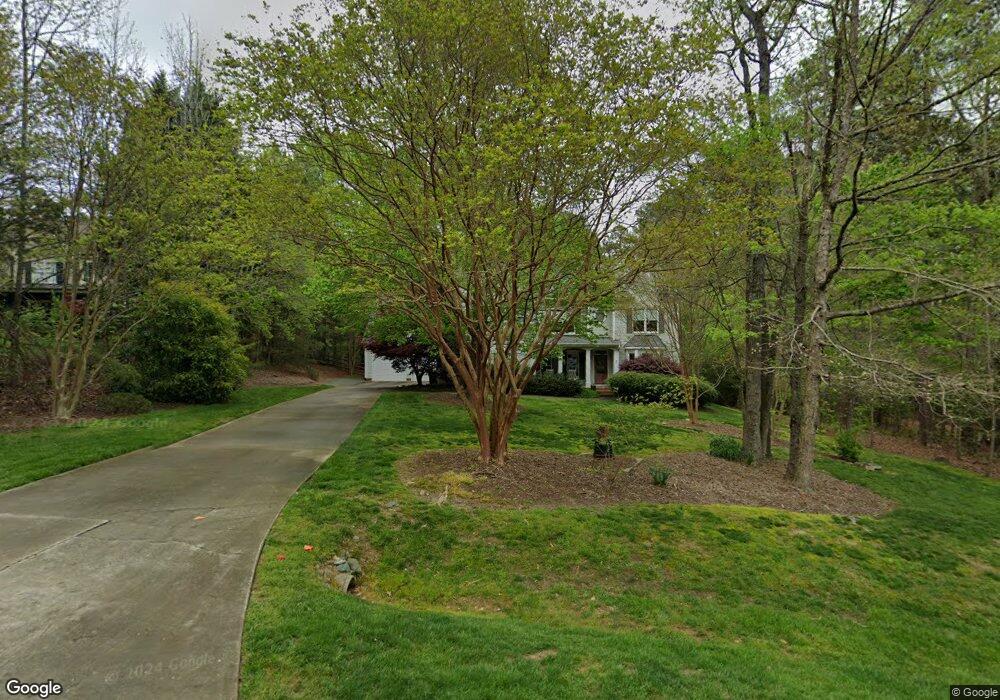
1011 Maple Ridge Dr Chapel Hill, NC 27516
Estimated Value: $1,105,000 - $1,424,000
4
Beds
4
Baths
4,303
Sq Ft
$293/Sq Ft
Est. Value
About This Home
This home is located at 1011 Maple Ridge Dr, Chapel Hill, NC 27516 and is currently estimated at $1,260,870, approximately $293 per square foot. 1011 Maple Ridge Dr is a home located in Orange County with nearby schools including Morris Grove Elementary School, McDougle Middle School, and Chapel Hill High School.
Ownership History
Date
Name
Owned For
Owner Type
Purchase Details
Closed on
Apr 21, 2010
Sold by
Runkle Paul R
Bought by
Collins Leslie M
Current Estimated Value
Home Financials for this Owner
Home Financials are based on the most recent Mortgage that was taken out on this home.
Original Mortgage
$417,000
Outstanding Balance
$276,909
Interest Rate
4.94%
Mortgage Type
New Conventional
Estimated Equity
$983,961
Purchase Details
Closed on
Mar 30, 2006
Sold by
Guest Thomas and Guest Carrie
Bought by
Runkle Paul R and Collins Leslie M
Home Financials for this Owner
Home Financials are based on the most recent Mortgage that was taken out on this home.
Original Mortgage
$574,000
Interest Rate
6.25%
Mortgage Type
Purchase Money Mortgage
Purchase Details
Closed on
Apr 27, 2002
Sold by
Toselli Richard Mark and Toselli Carole V
Bought by
Guest Thomas and Guest Carrie
Home Financials for this Owner
Home Financials are based on the most recent Mortgage that was taken out on this home.
Original Mortgage
$427,500
Interest Rate
3.12%
Mortgage Type
Fannie Mae Freddie Mac
Create a Home Valuation Report for This Property
The Home Valuation Report is an in-depth analysis detailing your home's value as well as a comparison with similar homes in the area
Home Values in the Area
Average Home Value in this Area
Purchase History
| Date | Buyer | Sale Price | Title Company |
|---|---|---|---|
| Collins Leslie M | -- | None Available | |
| Runkle Paul R | $718,000 | None Available | |
| Guest Thomas | $570,000 | -- |
Source: Public Records
Mortgage History
| Date | Status | Borrower | Loan Amount |
|---|---|---|---|
| Open | Collins Leslie M | $417,000 | |
| Previous Owner | Runkle Paul R | $574,000 | |
| Previous Owner | Guest Thomas | $427,500 |
Source: Public Records
Tax History Compared to Growth
Tax History
| Year | Tax Paid | Tax Assessment Tax Assessment Total Assessment is a certain percentage of the fair market value that is determined by local assessors to be the total taxable value of land and additions on the property. | Land | Improvement |
|---|---|---|---|---|
| 2025 | $8,706 | $1,000,700 | $249,600 | $751,100 |
| 2024 | $9,217 | $793,900 | $207,600 | $586,300 |
| 2023 | $9,217 | $793,900 | $207,600 | $586,300 |
| 2022 | $8,771 | $793,900 | $207,600 | $586,300 |
| 2021 | $8,592 | $793,900 | $207,600 | $586,300 |
| 2020 | $9,248 | $800,300 | $255,600 | $544,700 |
| 2018 | $9,098 | $800,300 | $255,600 | $544,700 |
| 2017 | $9,749 | $800,300 | $255,600 | $544,700 |
| 2016 | $9,749 | $833,800 | $157,000 | $676,800 |
| 2015 | $9,666 | $833,800 | $157,000 | $676,800 |
| 2014 | $9,646 | $833,800 | $157,000 | $676,800 |
Source: Public Records
Map
Nearby Homes
- 1005 Wood Sage Dr
- 1040 Millbrook Cir
- 8095 Old Nc 86
- Lot 4a Millbrook Cir
- 4b Millbrook Cir
- Lot 1c Millbrook Cir
- 2b Millbrook Cir
- 1134 Millbrook Cir
- 1841 Dots Dr
- 804 Long Meadows Rd
- 102 Shadow Ridge Place
- 8780 Old Nc 86
- 287 Twisted Oak Way
- 204 Towne Ridge Ln
- 811 Oxbow Crossing Rd
- 214 Towne Ridge Ln
- 222 Towne Ridge Ln
- 304 Homestead Rd
- 101 Standing Rock Rd Unit 27516
- 6006 Meadow Run Ct
- 1009 Maple Ridge Dr
- 1013 Maple Ridge Dr
- 1006 Maple Ridge Dr
- 1007 Maple Ridge Dr
- 1005 Maple Ridge Dr
- 1008 Maple Ridge Dr
- 1010 Maple Ridge Dr
- 7805 Talbryn Way
- 1004 Maple Ridge Dr
- 7623 Talbryn Way
- 1002 Maple Ridge Dr
- 1004 Wood Sage Dr
- 1006 Wood Sage Dr
- 1008 Wood Sage Dr
- 1003 Maple Ridge Dr
- 12 lot Talbryn Way
- 0 Talbryn Way Unit 446528
- 0 Talbryn Way Unit 1730615
- Lot 12 Talbryn Way
- 0 Talbryn Way Unit 12 TR1730615