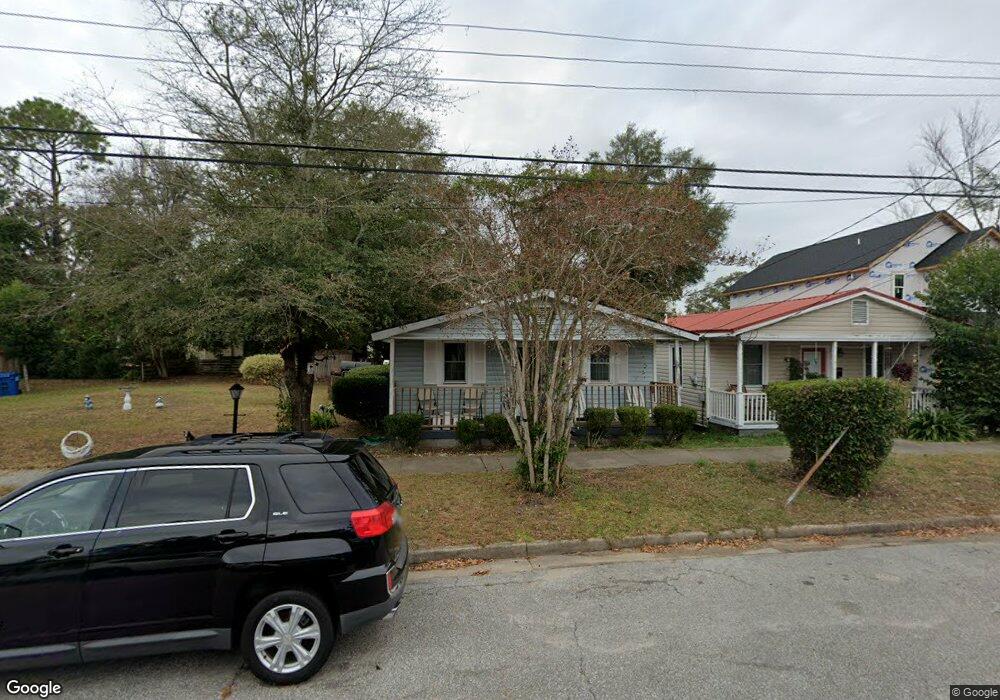
1011 N 7th St Wilmington, NC 28401
Northside NeighborhoodEstimated Value: $184,000 - $389,000
2
Beds
1
Bath
1,136
Sq Ft
$251/Sq Ft
Est. Value
About This Home
This home is located at 1011 N 7th St, Wilmington, NC 28401 and is currently estimated at $284,578, approximately $250 per square foot. 1011 N 7th St is a home located in New Hanover County with nearby schools including Snipes Academy of Arts & Design, Williston Middle School, and New Hanover High School.
Ownership History
Date
Name
Owned For
Owner Type
Purchase Details
Closed on
Sep 30, 2009
Sold by
Sherrill Jimmy
Bought by
Lamb Tammy Yvette
Current Estimated Value
Home Financials for this Owner
Home Financials are based on the most recent Mortgage that was taken out on this home.
Original Mortgage
$78,000
Outstanding Balance
$51,011
Interest Rate
5.11%
Mortgage Type
Seller Take Back
Estimated Equity
$233,567
Purchase Details
Closed on
Apr 20, 2005
Sold by
R & M Restorations Llc
Bought by
Sherrill Jimmy
Purchase Details
Closed on
Apr 18, 2005
Sold by
Armond Raymond
Bought by
R & M Restorations Llc
Purchase Details
Closed on
Jan 21, 2001
Sold by
Armond Raymond
Bought by
Armond Raymond Hrs
Purchase Details
Closed on
Aug 27, 1996
Sold by
Jackson Mary
Bought by
Armond Raymond
Purchase Details
Closed on
Jul 1, 1976
Bought by
Jackson Josh Mary
Create a Home Valuation Report for This Property
The Home Valuation Report is an in-depth analysis detailing your home's value as well as a comparison with similar homes in the area
Home Values in the Area
Average Home Value in this Area
Purchase History
| Date | Buyer | Sale Price | Title Company |
|---|---|---|---|
| Lamb Tammy Yvette | $80,000 | None Available | |
| Sherrill Jimmy | -- | None Available | |
| R & M Restorations Llc | $44,706 | None Available | |
| Armond Raymond Hrs | -- | -- | |
| Armond Raymond | -- | -- | |
| Jackson Josh Mary | $3,000 | -- |
Source: Public Records
Mortgage History
| Date | Status | Borrower | Loan Amount |
|---|---|---|---|
| Open | Lamb Tammy Yvette | $78,000 |
Source: Public Records
Tax History Compared to Growth
Tax History
| Year | Tax Paid | Tax Assessment Tax Assessment Total Assessment is a certain percentage of the fair market value that is determined by local assessors to be the total taxable value of land and additions on the property. | Land | Improvement |
|---|---|---|---|---|
| 2023 | $1,235 | $142,000 | $43,600 | $98,400 |
| 2022 | $1,207 | $142,000 | $43,600 | $98,400 |
| 2021 | $1,215 | $142,000 | $43,600 | $98,400 |
| 2020 | $656 | $62,300 | $17,000 | $45,300 |
| 2019 | $656 | $62,300 | $17,000 | $45,300 |
| 2018 | $0 | $62,300 | $17,000 | $45,300 |
| 2017 | $656 | $62,300 | $17,000 | $45,300 |
| 2016 | $656 | $59,200 | $18,500 | $40,700 |
| 2015 | -- | $59,200 | $18,500 | $40,700 |
| 2014 | $600 | $59,200 | $18,500 | $40,700 |
Source: Public Records
Map
Nearby Homes