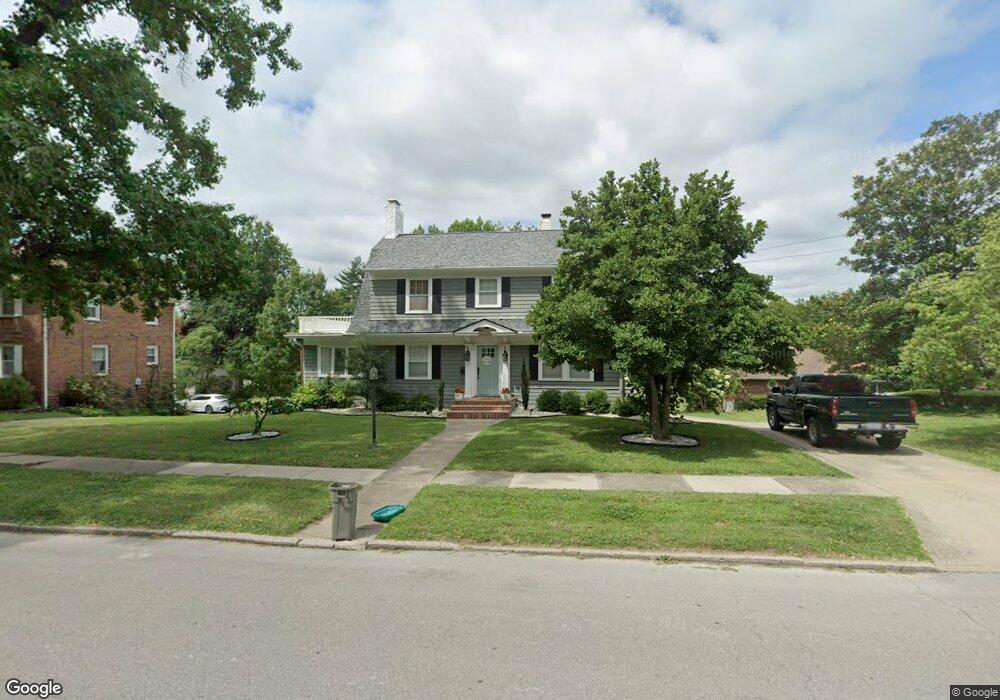
1011 N Main St Carrollton, MO 64633
Estimated Value: $185,527 - $278,000
6
Beds
4
Baths
3,107
Sq Ft
$74/Sq Ft
Est. Value
About This Home
This home is located at 1011 N Main St, Carrollton, MO 64633 and is currently estimated at $231,132, approximately $74 per square foot. 1011 N Main St is a home located in Carroll County with nearby schools including Carrollton Elementary School and Carrollton High School.
Ownership History
Date
Name
Owned For
Owner Type
Purchase Details
Closed on
Oct 19, 2022
Sold by
Green Brandon Lee and Green Joslyn R
Bought by
Herring Chris and Herring Anna
Current Estimated Value
Home Financials for this Owner
Home Financials are based on the most recent Mortgage that was taken out on this home.
Original Mortgage
$160,000
Outstanding Balance
$154,944
Interest Rate
5.89%
Mortgage Type
New Conventional
Estimated Equity
$76,188
Create a Home Valuation Report for This Property
The Home Valuation Report is an in-depth analysis detailing your home's value as well as a comparison with similar homes in the area
Home Values in the Area
Average Home Value in this Area
Purchase History
| Date | Buyer | Sale Price | Title Company |
|---|---|---|---|
| Herring Chris | -- | -- |
Source: Public Records
Mortgage History
| Date | Status | Borrower | Loan Amount |
|---|---|---|---|
| Open | Herring Chris | $160,000 | |
| Previous Owner | Wellman Kelly M | $145,000 | |
| Previous Owner | Wellman Kelly | $20,000 | |
| Previous Owner | Wellman Kelly M | $108,000 |
Source: Public Records
Tax History Compared to Growth
Tax History
| Year | Tax Paid | Tax Assessment Tax Assessment Total Assessment is a certain percentage of the fair market value that is determined by local assessors to be the total taxable value of land and additions on the property. | Land | Improvement |
|---|---|---|---|---|
| 2024 | $1,617 | $26,050 | $1,900 | $24,150 |
| 2023 | $1,616 | $26,050 | $1,900 | $24,150 |
| 2022 | $1,634 | $26,050 | $1,900 | $24,150 |
| 2021 | $1,633 | $26,050 | $1,900 | $24,150 |
| 2020 | $1,625 | $26,050 | $1,900 | $24,150 |
| 2019 | $1,619 | $26,050 | $1,900 | $24,150 |
| 2018 | $1,617 | $26,050 | $1,900 | $24,150 |
| 2017 | $1,990 | $26,050 | $1,900 | $24,150 |
| 2016 | $1,628 | $26,050 | $0 | $0 |
| 2015 | -- | $26,050 | $0 | $0 |
| 2014 | -- | $25,470 | $0 | $0 |
| 2013 | -- | $24,500 | $0 | $0 |
Source: Public Records
Map
Nearby Homes