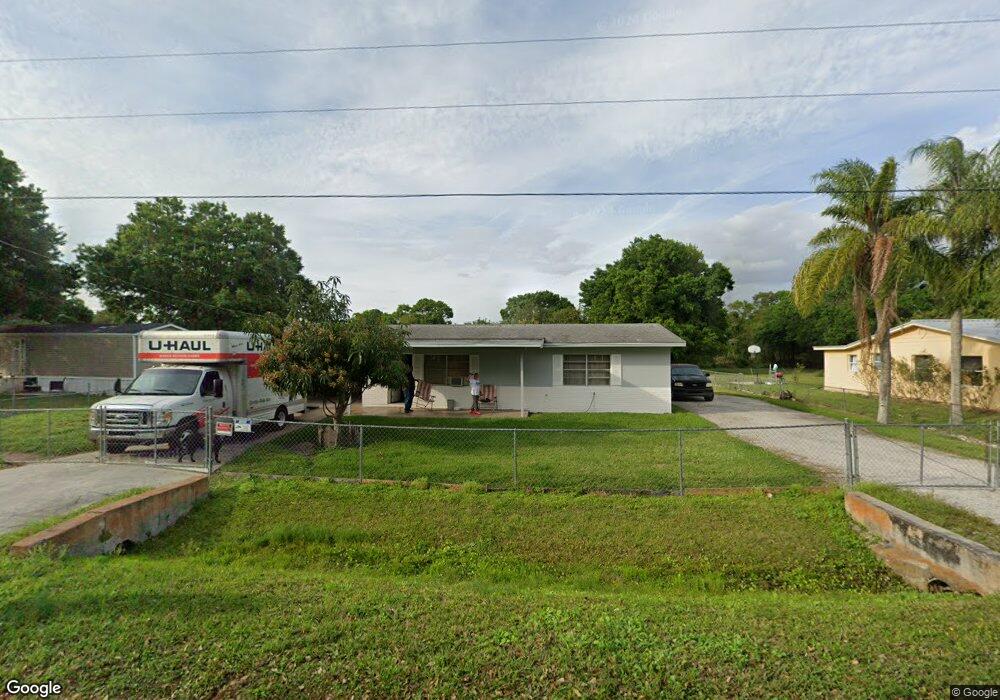
1011 NW 39th Cir Okeechobee, FL 34972
Estimated Value: $213,000 - $278,000
4
Beds
4
Baths
1,712
Sq Ft
$137/Sq Ft
Est. Value
About This Home
This home is located at 1011 NW 39th Cir, Okeechobee, FL 34972 and is currently estimated at $234,735, approximately $137 per square foot. 1011 NW 39th Cir is a home located in Okeechobee County with nearby schools including North Elementary School, Yearling Middle School, and Okeechobee High School.
Ownership History
Date
Name
Owned For
Owner Type
Purchase Details
Closed on
Jun 4, 2010
Sold by
Laskey Richard and Laskey Robert
Bought by
Rebollar Patricio and Carillo Fransisca
Current Estimated Value
Home Financials for this Owner
Home Financials are based on the most recent Mortgage that was taken out on this home.
Original Mortgage
$49,638
Interest Rate
8.75%
Mortgage Type
Seller Take Back
Purchase Details
Closed on
Feb 8, 2010
Sold by
Pnc Bank National Association
Bought by
Laskey Richard and Laskey Robert
Purchase Details
Closed on
Jul 20, 2009
Sold by
Spath Donald C and Claveria Louis
Bought by
National City Bank
Purchase Details
Closed on
Jan 10, 2006
Sold by
Claveria Louis M
Bought by
Spath Donald C
Home Financials for this Owner
Home Financials are based on the most recent Mortgage that was taken out on this home.
Original Mortgage
$90,000
Interest Rate
6.19%
Mortgage Type
Fannie Mae Freddie Mac
Create a Home Valuation Report for This Property
The Home Valuation Report is an in-depth analysis detailing your home's value as well as a comparison with similar homes in the area
Home Values in the Area
Average Home Value in this Area
Purchase History
| Date | Buyer | Sale Price | Title Company |
|---|---|---|---|
| Rebollar Patricio | $60,000 | Elite Title Inc | |
| Laskey Richard | $15,000 | Attorney | |
| National City Bank | -- | None Available | |
| Spath Donald C | $120,000 | Okee Tantie Title Co Inc |
Source: Public Records
Mortgage History
| Date | Status | Borrower | Loan Amount |
|---|---|---|---|
| Closed | Rebollar Patricio | $49,638 | |
| Previous Owner | Spath Donald C | $90,000 |
Source: Public Records
Tax History
| Year | Tax Paid | Tax Assessment Tax Assessment Total Assessment is a certain percentage of the fair market value that is determined by local assessors to be the total taxable value of land and additions on the property. | Land | Improvement |
|---|---|---|---|---|
| 2025 | $955 | $47,481 | -- | -- |
| 2024 | $901 | $46,143 | -- | -- |
| 2023 | $849 | $44,799 | $0 | $0 |
| 2022 | $425 | $39,158 | $0 | $0 |
| 2021 | $407 | $38,017 | $0 | $0 |
| 2020 | $395 | $37,492 | $0 | $0 |
| 2019 | $376 | $36,649 | $0 | $0 |
| 2018 | $369 | $35,966 | $0 | $0 |
| 2017 | $334 | $35,226 | $0 | $0 |
| 2016 | $326 | $34,501 | $0 | $0 |
| 2015 | $329 | $34,261 | $0 | $0 |
| 2014 | -- | $33,989 | $0 | $0 |
Source: Public Records
Map
Nearby Homes
- 3565 NW 10th Ave
- 448 NW 34th St
- 3632 NW 16th Ave
- 3671 NW 16th Ave
- 3422 NW 17th Ave
- 3848 NW 19th Ave
- 3573 NW 18th Ave
- 3311 NW 17th Ave
- 0 NW 30th Ln
- 3497 NW 19th Ave
- 508 NW 30th Ln
- 3382 NW 22nd Ave
- 3497 NW 24th Ave
- 3844 NW 26th Ave
- 3709 NW 26th Ave
- 3935 NW 27th Ave
- 3632 NW 28th Ave
- 3224 NW 27th Ave
- 3458 NW 28th Ave
- 1000 NW 50th Dr
- 1010 NW 39th Cir
- 1008 NW 39th Cir
- 981 NW 39th Cir
- 949 NW 39th Cir
- 918 NW 39th Cir
- 919 NW 39th Cir
- 1133 NW 39th Cir
- 957 NW 36th St
- 1163 NW 36th St
- 1163 NW 39th Cir
- 867 NW 36th St
- 1195 NW 39th Cir
- 868 NW 36th St
- 831 NW 36th St
- 3590 NW 12th Ave
- 3695 NW 8th Ave
- 801 NW 39th Cir
- 801 NW 36th St
- 769 NW 36th St
- 1283 NW 39th Cir
Your Personal Tour Guide
Ask me questions while you tour the home.