1011 NW 6th Place Cape Coral, FL 33993
Mariner NeighborhoodEstimated Value: $313,133 - $392,000
4
Beds
2
Baths
1,978
Sq Ft
$183/Sq Ft
Est. Value
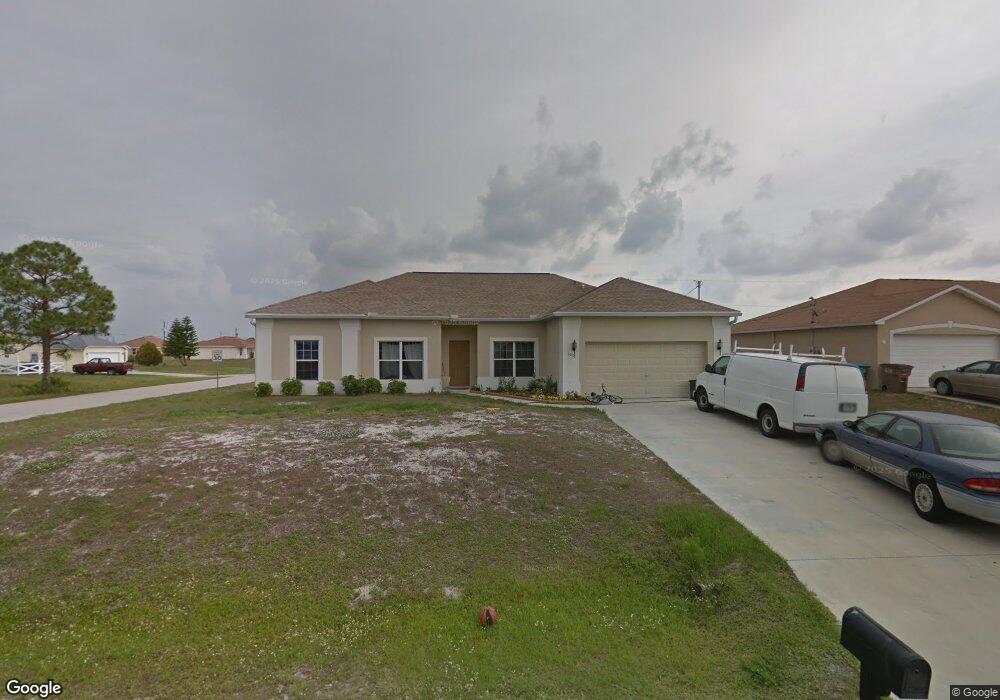
About This Home
This home is located at 1011 NW 6th Place, Cape Coral, FL 33993 and is currently estimated at $362,783, approximately $183 per square foot. 1011 NW 6th Place is a home located in Lee County with nearby schools including Caloosa Elementary School, Tropic Isles Elementary School, and Dr. Carrie D. Robinson Littleton Elementary School.
Ownership History
Date
Name
Owned For
Owner Type
Purchase Details
Closed on
Sep 30, 2023
Sold by
Lamountain Robert P and Lamountain Donna A
Bought by
Lamountain Donna A
Current Estimated Value
Purchase Details
Closed on
Jun 4, 2009
Sold by
Ctx Mortgage Company Llc
Bought by
Lamountain Robert P
Home Financials for this Owner
Home Financials are based on the most recent Mortgage that was taken out on this home.
Original Mortgage
$116,353
Interest Rate
4.77%
Mortgage Type
FHA
Purchase Details
Closed on
Jan 27, 2009
Sold by
Beepot Suielal
Bought by
Ctx Mortgage Company Llc
Purchase Details
Closed on
Oct 7, 2005
Sold by
Defilippo Dorothy
Bought by
Beepot Suielal
Home Financials for this Owner
Home Financials are based on the most recent Mortgage that was taken out on this home.
Original Mortgage
$283,340
Interest Rate
8.75%
Mortgage Type
Construction
Create a Home Valuation Report for This Property
The Home Valuation Report is an in-depth analysis detailing your home's value as well as a comparison with similar homes in the area
Home Values in the Area
Average Home Value in this Area
Purchase History
| Date | Buyer | Sale Price | Title Company |
|---|---|---|---|
| Lamountain Donna A | $100 | None Listed On Document | |
| Lamountain Robert P | $118,500 | Metropolitan Title & Guarant | |
| Ctx Mortgage Company Llc | -- | Attorney | |
| Beepot Suielal | $93,500 | Platinum Land Title Agency I |
Source: Public Records
Mortgage History
| Date | Status | Borrower | Loan Amount |
|---|---|---|---|
| Previous Owner | Lamountain Robert P | $116,353 | |
| Previous Owner | Beepot Suielal | $283,340 |
Source: Public Records
Tax History Compared to Growth
Tax History
| Year | Tax Paid | Tax Assessment Tax Assessment Total Assessment is a certain percentage of the fair market value that is determined by local assessors to be the total taxable value of land and additions on the property. | Land | Improvement |
|---|---|---|---|---|
| 2025 | $4,711 | $292,972 | -- | -- |
| 2024 | $1,718 | $284,715 | $33,527 | $247,368 |
| 2023 | $1,718 | $95,857 | $0 | $0 |
| 2022 | $1,524 | $93,065 | $0 | $0 |
| 2021 | $1,467 | $187,988 | $11,307 | $176,681 |
| 2020 | $1,414 | $86,930 | $0 | $0 |
| 2019 | $1,361 | $84,976 | $0 | $0 |
| 2018 | $1,335 | $83,392 | $0 | $0 |
| 2017 | $1,309 | $81,677 | $0 | $0 |
| 2016 | $1,247 | $146,127 | $6,800 | $139,327 |
| 2015 | $1,224 | $130,808 | $6,300 | $124,508 |
| 2014 | $1,260 | $123,616 | $5,640 | $117,976 |
| 2013 | -- | $109,800 | $4,100 | $105,700 |
Source: Public Records
Map
Nearby Homes
- 936 NW 6th Ave
- 933 NW 7th Ave
- 919 NW 6th Place
- 614 NW 9th St
- 1019 NW 7th Place
- 1025 NW 7th Place
- 626 NW 9th St
- 518 NW 11th Terrace
- 1012 NW 7th Place
- 422 NW 9th Terrace
- 1020 NW 7th Place
- 428 NW 9th St Unit 25
- 1001 Nelson Rd N
- 627 NW 8th Terrace
- 1116 NW 5th Place
- 701 NW 8th Terrace
- 405 NW 10th St
- 402 NW 10th St
- 412 NW 9th St
- 407 NW 9th St
- 1007 NW 6th Place
- 1010 NW 6th Ave
- 1006 NW 6th Ave
- 1003 NW 6th Place
- 613 NW 10th Terrace
- 1010 NW 6th Place
- 609 NW 10th Terrace Unit 48
- 1006 NW 6th Place
- 1002 NW 6th Ave
- 605 NW 10th Terrace
- 617 NW 10th Terrace
- 601 NW 10th Terrace
- 1002 NW 6th Place
- 941 NW 6th Place
- 623 NW 10th Terrace
- 1011 NW 6th Ave
- 942 NW 6th Place
- 608 NW 11th St
- 618 NW 11th St
- 620 NW 11th St