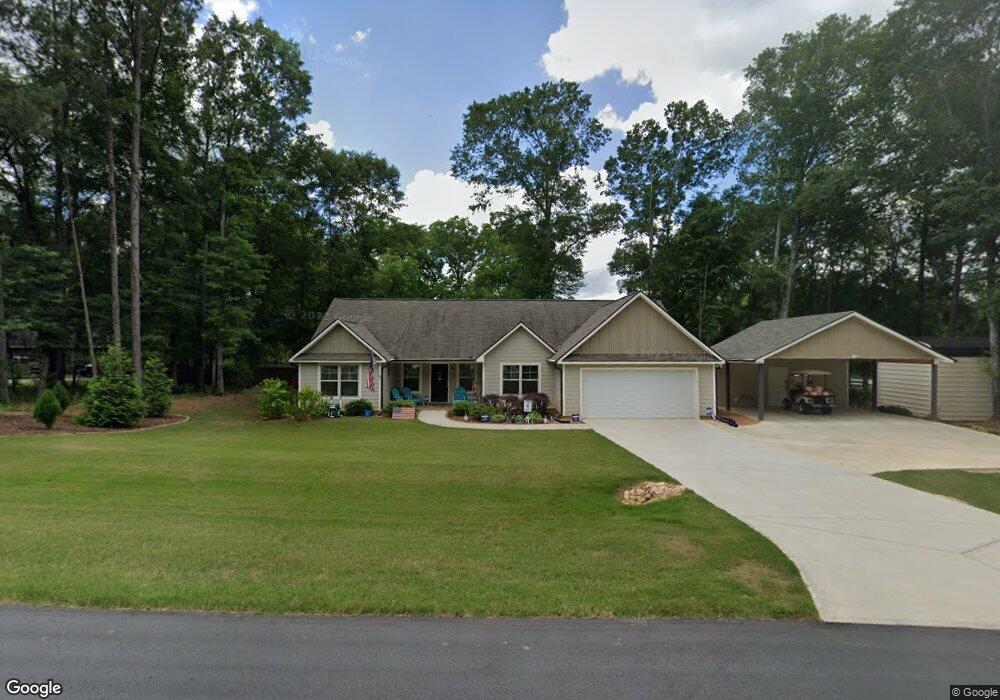
1011 Oak Hill Ln Unit 10 Madison, GA 30650
Buckhead Morgan NeighborhoodEstimated Value: $343,605 - $370,000
3
Beds
2
Baths
1,616
Sq Ft
$223/Sq Ft
Est. Value
About This Home
This home is located at 1011 Oak Hill Ln Unit 10, Madison, GA 30650 and is currently estimated at $360,151, approximately $222 per square foot. 1011 Oak Hill Ln Unit 10 is a home located in Morgan County with nearby schools including Morgan County Primary School, Morgan County Elementary School, and Morgan County Middle School.
Ownership History
Date
Name
Owned For
Owner Type
Purchase Details
Closed on
Sep 12, 2024
Sold by
Moore Doyle M
Bought by
Moore Doyle Tr and Moore Janelle Tr
Current Estimated Value
Purchase Details
Closed on
May 18, 2020
Sold by
Phillips Terry R
Bought by
Moore Doyle M and Moore Janelle G
Purchase Details
Closed on
Sep 28, 2018
Sold by
Rbc Homes Llc
Bought by
Phillips Terry R and Phillips Maria H
Home Financials for this Owner
Home Financials are based on the most recent Mortgage that was taken out on this home.
Original Mortgage
$179,900
Interest Rate
4.5%
Purchase Details
Closed on
Jun 7, 2018
Sold by
Bank Of Madison
Bought by
Rbc Homes Llc
Home Financials for this Owner
Home Financials are based on the most recent Mortgage that was taken out on this home.
Original Mortgage
$135,000
Interest Rate
4.5%
Mortgage Type
Purchase Money Mortgage
Purchase Details
Closed on
Nov 1, 2011
Sold by
Breco Land & Development Llc
Bought by
Bank Of Madison
Create a Home Valuation Report for This Property
The Home Valuation Report is an in-depth analysis detailing your home's value as well as a comparison with similar homes in the area
Home Values in the Area
Average Home Value in this Area
Purchase History
| Date | Buyer | Sale Price | Title Company |
|---|---|---|---|
| Moore Doyle Tr | -- | -- | |
| Moore Doyle M | $200,000 | -- | |
| Phillips Terry R | $179,900 | -- | |
| Rbc Homes Llc | $15,000 | -- | |
| Bank Of Madison | $279,734 | -- |
Source: Public Records
Mortgage History
| Date | Status | Borrower | Loan Amount |
|---|---|---|---|
| Previous Owner | Phillips Terry R | $179,900 | |
| Previous Owner | Rbc Homes Llc | $135,000 |
Source: Public Records
Tax History Compared to Growth
Tax History
| Year | Tax Paid | Tax Assessment Tax Assessment Total Assessment is a certain percentage of the fair market value that is determined by local assessors to be the total taxable value of land and additions on the property. | Land | Improvement |
|---|---|---|---|---|
| 2024 | $2,414 | $123,403 | $24,200 | $99,203 |
| 2023 | $2,250 | $113,200 | $24,200 | $89,000 |
| 2022 | $1,679 | $80,651 | $14,400 | $66,251 |
| 2021 | $1,922 | $78,251 | $12,000 | $66,251 |
| 2020 | $1,740 | $69,083 | $5,800 | $63,283 |
| 2019 | $1,740 | $69,083 | $5,800 | $63,283 |
| 2018 | $148 | $5,800 | $5,800 | $0 |
| 2017 | $150 | $5,800 | $5,800 | $0 |
| 2016 | $53 | $2,000 | $2,000 | $0 |
| 2015 | $54 | $2,000 | $2,000 | $0 |
| 2014 | $52 | $2,000 | $2,000 | $0 |
| 2013 | -- | $2,000 | $2,000 | $0 |
Source: Public Records
Map
Nearby Homes
- 1040 River Woods Dr
- 1061 Apalachee Shores Ct
- 1051 Apalachee Shores Ct
- 1041 Apalachee Shores Ct
- 1170 River Woods Dr
- 1051 Meadow Ln
- 1220 Waterstone Dr
- 1501 Meadow Ln
- 1061 Shoreline Dr
- 1751 Apalachee River Rd
- 1010 Shoreline Dr
- 1000 Shoreline Dr
- 1050 Sugar Creek Church Rd
- 1031 Whispering Lakes Trail
- 1.23 ACRES Heidi Trail
- 1400 Heidi Trail
- 0 Cleveland Ave Unit 10495992
- 1597 Oconee Rd
- 1290 Heidi Trail
- 1080 Cleveland Ave
- 1011 Oak Hill Ln
- 1230 Apalachee River Rd
- 1601 Oak Hill Ln
- 1031 Oak Hill Ln
- 1290 Apalachee River Rd
- 1280 Apalachee River Rd
- 1010 Oak Hill Ln Unit 9
- 1010 Oak Hill Ln
- 1030 Oak Hill Ln
- 1041 Oak Hill Ln
- 0 Oak Hill Ln Unit 9043997
- 0 Oak Hill Ln Unit 8146117
- 1050 Oak Hill Ln
- 1051 Oak Hill Ln Unit 51
- 1051 Oak Hill Ln Unit 13
- 1270 Apalachee River Rd
- 1021 Apal River Woods Dr
- 1140 Apalachee River Rd
- 1061 Oak Hill Ln
- 1171 Apalachee River Rd